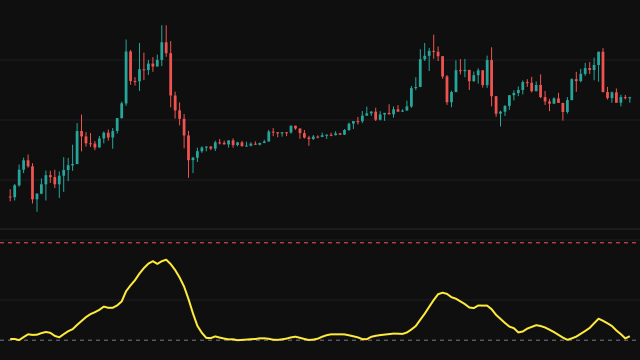
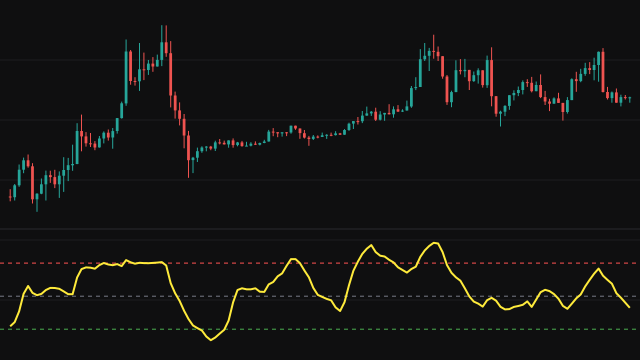
Qstick averages the body of each candle: the close minus the open. A positive body means the bar closed above its open, a negative body that it closed below. Averaging those bodies shows whether buying or selling has dominated within the bars over the recent past.
Two averages are offered. The simple form starts on the first bar as a mean of every body seen so far and becomes a rolling mean of the last length bars once that many have arrived. The exponential form starts its recursion at zero on the first bar, so its earliest readings are pulled toward zero before they settle.
The pane is shaded green behind bars where the reading is above zero and red where it is at or below zero, and a dashed line marks zero.
How to read Qstick Indicator
Above zero, candles have on balance been closing higher than they opened, which points to buying pressure inside the bars. Below zero, the reverse. A cross of the zero line, which flips the background colour, marks a change in which side has controlled the bars.
Qstick looks only at the body of each bar and ignores gaps between bars, so a market that gaps up and then drifts lower within each bar can read negative while price rises. A longer length smooths out single large candles; the exponential form reacts faster than the simple one.
Settings
- Length
- How many bars the average covers. A longer length gives a smoother line that crosses zero less often.
- MA Type
- Chooses a simple mean of the bodies or an exponential one. The exponential form weights recent bars more and starts from zero.
- Close Source
- The series used as the close of each body. Changing it measures a different part of the bar.
- Open Source
- The series used as the open of each body, subtracted from the close source on every bar.
Frequently asked questions
Why does the line start on the first bar?
The simple form averages however many bodies it has until it holds a full window, and the exponential form starts from zero, so both answer from the first bar.
What does the background colour show?
Green behind bars where the reading is above zero and red where it is zero or below, so the side in control is visible without reading the scale.
Why does Qstick disagree with the price trend sometimes?
It measures only close minus open inside each bar. Gaps between bars are left out, so a rising market built on opening gaps can still show a negative reading.