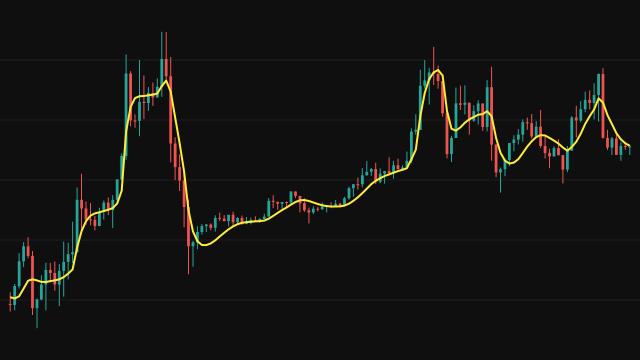
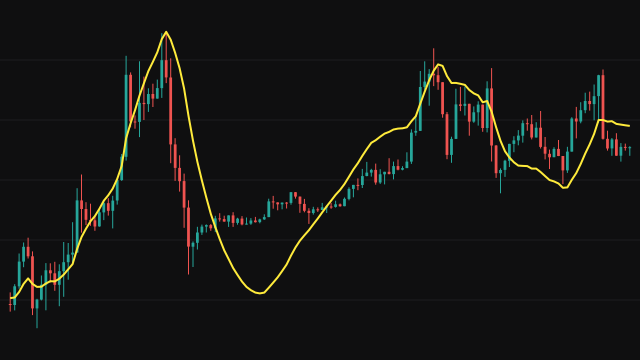
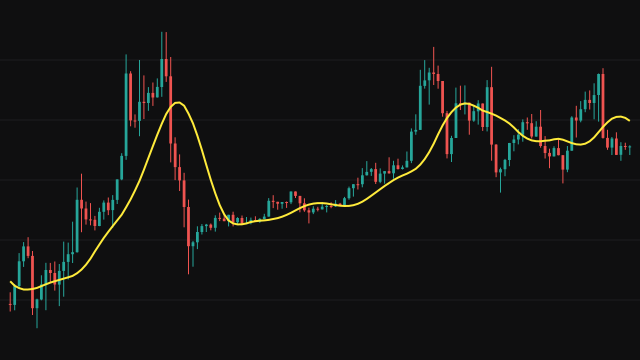
The Integral of Linear Regression Slope fits a least squares straight line to the last period prices on every bar and keeps only its slope, the average change per bar over the window. It then adds that slope to a running total that starts at the first price. The line is the running sum, or integral, of trend speed.
When price rises steadily the slope is positive and the line climbs at the same rate; when price falls it declines. Until the window is full the slope is fitted to the bars seen so far, and on the first bar the line equals the price. A missing price counts as zero in the fit.
How to read Integral of Linear Regression Slope (ILRS)
Read the ILRS as a smooth price follower. Its direction is the sign of the regression slope, so a rising line means the fitted trend over the window points up and a falling line means it points down. It turns as soon as the slope changes sign, which is earlier than most averages of the same length.
Because it is a running total of slopes rather than an average of prices, it can drift away from price over a long chart, so judge it by its direction and turns rather than by its level relative to the close.
Settings
- Source
- The price series the regression is fitted to, the close by default.
- Period
- Number of bars in the regression window. A longer window gives a steadier slope that changes direction later.
Frequently asked questions
Why does the line not always sit near price?
It is built by adding up slopes from the first price, not by averaging prices, so small differences accumulate and the line can drift apart from the close over a long chart.
How does it relate to a least squares moving average?
Both fit a straight line to the window. The least squares average plots the fitted value at the newest bar; this line adds up the fitted slope from bar to bar.
What does a flat line mean?
The regression slope is near zero, so prices across the window show no clear rising or falling trend.