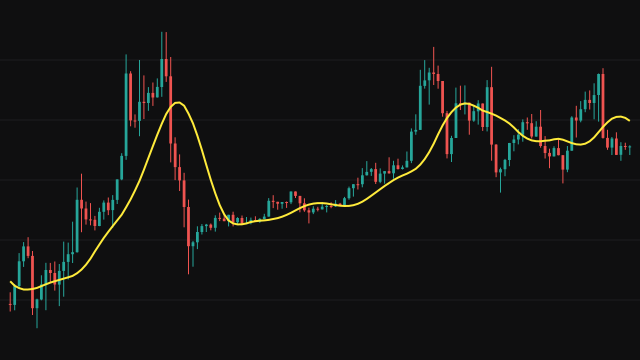
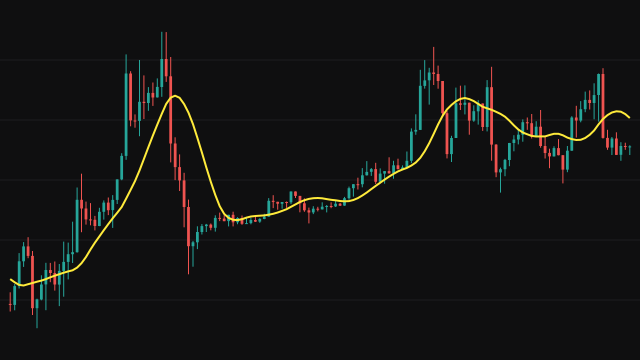
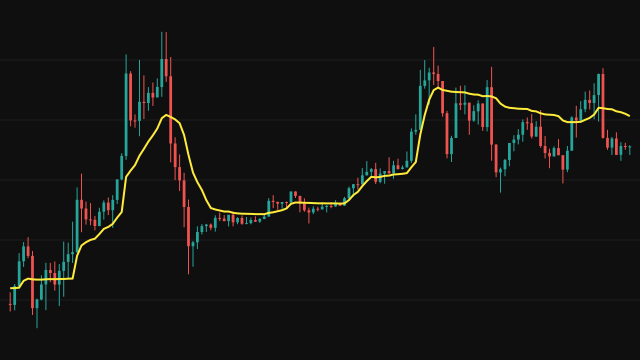
JMA measures volatility as how far price sits outside a pair of adaptive bands from the previous bar. That volatility is summed over ten bars and then given its own slow exponential average, and the ratio of the current volatility to that average is the relative volatility, held between 1 and a cap set by the period.
Relative volatility sets the smoothing for the bar: the base weight from the period and Power is raised to a power of the relative volatility, so a quiet bar is smoothed heavily and a volatile bar lets price through. The bands themselves are tightened toward price by the same measure.
The line passes through three stages: an adaptive average, a lead added from the difference between price and that average scaled by the phase, and a final adaptive filter that settles the result.
How to read Jurik Moving Average (JMA)
JMA is a smooth trend line that stays flat in a quiet range and moves quickly once a real move starts. Its slope is the trend; price crossing it with the line turning is a change of direction.
Phase trades lag against overshoot. A negative phase holds the line back and smooths it, a positive phase pushes it toward price and makes it overshoot at turns. Power sets the overall smoothness: lower values give a smoother, slower line.
Settings
- Period
- Number of bars the smoothing is built around. A longer period gives a smoother line and allows a larger volatility range.
- Phase
- From -100 to 100. Negative values reduce overshoot and add lag, positive values cut lag and add overshoot.
- Power
- From 0.1 to 1. Lower values make the base smoothing heavier and the curve smoother.
- Source
- The price series the average follows. Close is the usual choice; hl2 or another blend smooths out closes that jump around.
Frequently asked questions
Why does JMA stay flat in some stretches?
When volatility is low relative to its own average, the smoothing weight becomes very heavy and the line barely moves. That is the intended behaviour in a quiet range.
What does Phase do?
It scales a lead term added between the first and last stages. Raising it brings the line closer to price at the cost of overshoot at turns; lowering it does the opposite. The input tooltip says negative values reduce lag, but in the calculation it is a higher Phase that adds more of the lead term and brings the line closer to price.
Does it need a warmup?
No. Every stage starts from the first price, so the line is drawn from the first bar. The volatility average takes a while to settle, so the early adaptivity is rougher.