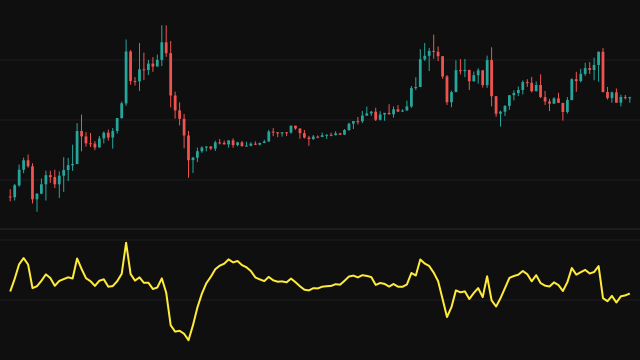
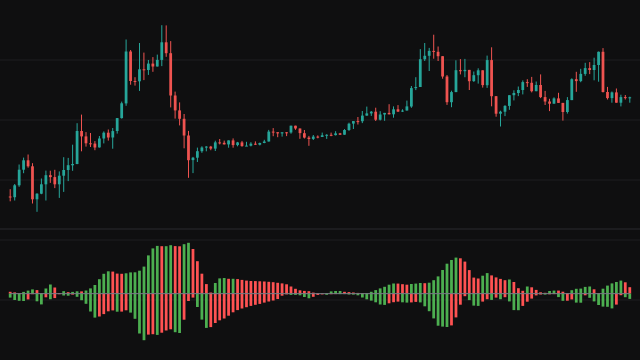
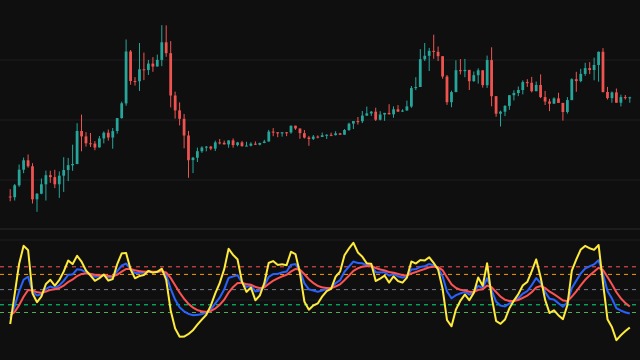
The Intraday Momentum Index works like a relative strength reading, but it compares each bar's close with its own open rather than with the previous close. A bar that closed above its open adds its body (close minus open) to the gains; a bar that closed below its open adds its body (open minus close) to the losses. A bar that closed exactly at its open adds nothing.
The study keeps running totals of the gains and losses over the last period bars. Bars before the first count as zero, so the line starts on the first bar with a shorter window. The plotted value is 100 times the gains divided by the gains plus the losses. When there are no bodies at all in the window, it reads 50.
How to read Intraday Momentum Index (IMI)
Readings above 50 mean more of the period's body size came from up bars, buying inside the bars; readings below 50 mean selling did. Values near 70 and above are often treated as overbought and values near 30 and below as oversold, and turns from those zones as the signal.
Because it ignores gaps between bars, the IMI can disagree with a close-to-close oscillator when price gaps and then drifts the other way within the bars. That disagreement is the information it adds. Short periods make it swing hard.
Settings
- Period
- The number of bars whose bodies are added up. A shorter period makes the oscillator react faster and reach its extremes more often.
Frequently asked questions
How is it different from RSI?
RSI measures changes from one close to the next. IMI measures each bar's close against its own open, so moves that happen as gaps between bars do not count.
Why does it read exactly 50 sometimes?
When every bar in the window closed at its open there are no bodies to compare, and the study reads that as neutral, 50.
Does it need intraday bars?
No. It works on any interval; each bar's open and close are what it reads, whatever length of time the bar covers.