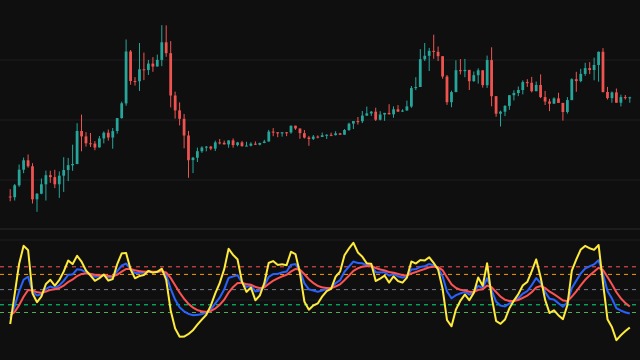
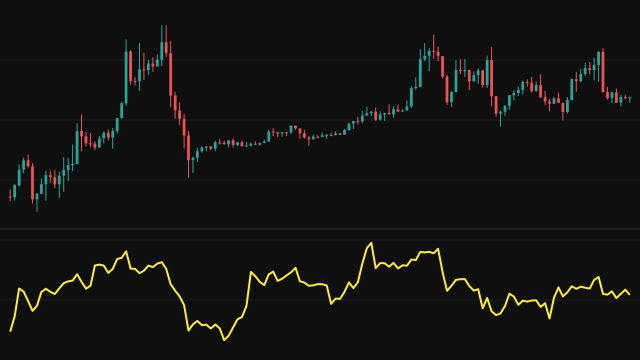
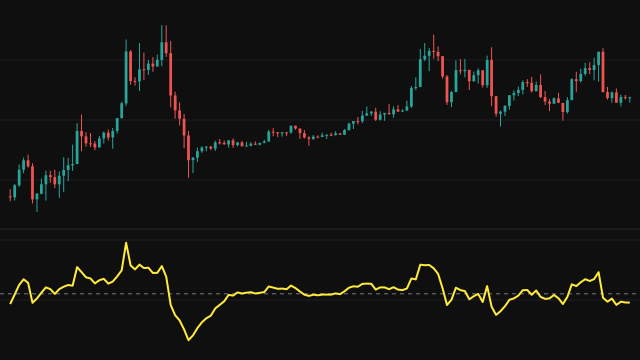
Inertia fits a straight line by least squares through the last values of the source, one value per bar, and takes the value of that line on the current bar. The plotted figure is the source minus that value: how far price sits above or below its own recent trend line.
The window is the length, or every bar so far when fewer bars exist, so the line starts on the first bar rather than after a warmup. A one-bar window has no slope, and the study reads it as 0. A missing value inside the window counts as zero in the fit, and a missing value on the current bar leaves the plot blank.
How to read Inertia
Positive values mean price has run ahead of the straight line through the recent bars, and negative values mean it has lagged behind. A value near zero means price is sitting on its trend line, whichever way that line slopes. Large readings show price stretched away from its trend, which often precedes either an acceleration or a pull back toward the line.
The value is in price units, so compare it with its own history. A short length tracks small swings and turns often, while a long length measures the stretch away from a broader trend.
Settings
- Length
- The number of bars the regression line is fitted through. On the opening bars the window is shorter, limited to the bars available.
- Source
- The price series the line is fitted to and compared with.
Frequently asked questions
Does a positive value mean the trend is up?
No. It means price is above its own trend line, which can slope up or down. A falling market that bounces can read positive while the line still slopes down.
Why does the first bar read zero?
On the first bar the window holds a single value, and a one-value fit has no slope, so the study reads it as zero.
What units is it in?
The units of the source, usually price. The same reading means a bigger stretch on a low-priced instrument than on a high-priced one.