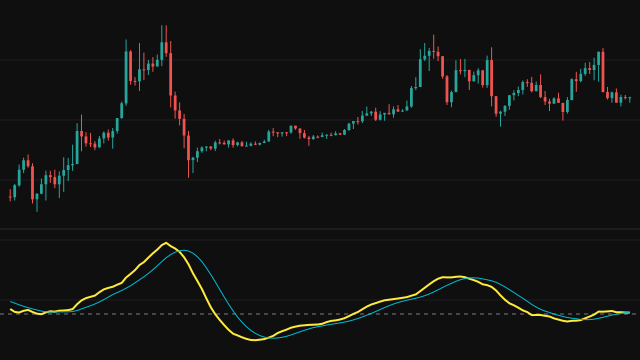
The Kairi Relative Index answers one question: how far, in percent, is price from its average? On each bar it takes a simple moving average of the source over the period and plots 100 times (source minus average) divided by the average.
The average starts on the first bar. Until the period has filled, it is the average of every value so far, so the line has no warmup gap. A missing source value enters the average as zero. If the average is exactly zero, the study reads 0.
How to read Kairi Relative Index (KRI)
Zero means price sits on its average. Positive values show price above the average by that many percent, and negative values below it. Large readings mark price stretched far from its mean, which traders often read as a setup for a pull back toward the average, especially when the reading turns back.
There are no fixed overbought or oversold levels: how far is far depends on the instrument and the period. Look at the extremes the line has reached on the same chart before, and remember that in a strong trend price can stay stretched for a long time.
Settings
- Source
- The price series compared with its own average.
- Period
- The number of bars in the simple moving average. A longer period gives a slower average and larger percentage readings.
Frequently asked questions
Why are percentages used instead of price?
A percentage distance means the same thing at any price level, so readings can be compared across instruments and across years of one chart.
Why does the line start on the first bar?
The average uses every value so far until a full period is available, so there is always an average to compare with.
What counts as an extreme reading?
It depends on the market's volatility and the period. Mark the levels where the line has turned before on the same chart and interval, and use those.