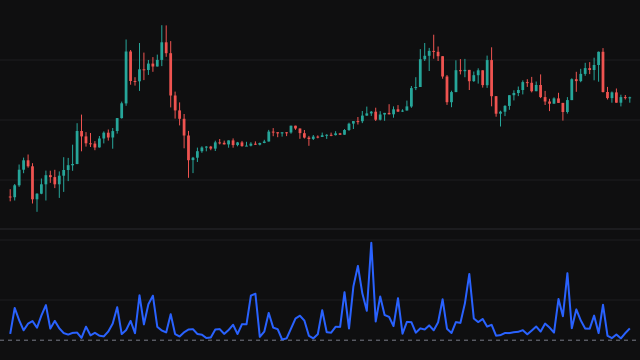
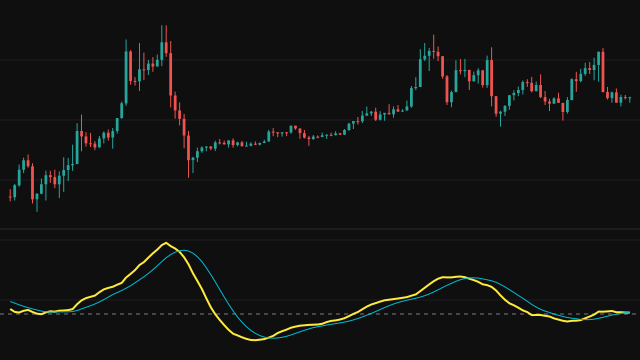
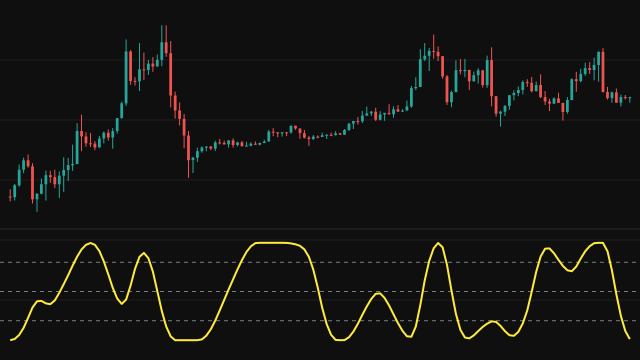
The Laguerre RSI replaces the fixed lookback of an ordinary RSI with four filter stages chained one after another. The first stage is an exponential smoothing of the close with weight 1 - gamma. Each later stage takes the stage above it, its own previous value and the upper stage's previous value, so every stage is a slightly more delayed copy of the price. All four stages start at zero.
On each bar the study compares neighbouring stages. Where a faster stage sits above the slower one below it, the gap counts as a rise; where it sits below, the gap counts as a fall. The rises are added into cu and the falls into cd, and the line is cu / (cu + cd), so it runs from 0 to 1. When all four stages agree exactly, as on a perfectly flat market, the study reads 0.5.
Gamma is the only setting. A low gamma lets each stage follow price closely, so the line reacts within a bar or two and swings hard between the extremes. A high gamma makes every stage slower and the line smoother.
How to read LRSI: Laguerre RSI
Read it like a fast RSI on a 0 to 1 scale. Above 0.8 the recent bars have been almost all rises, below 0.2 almost all falls, and 0.5 is balance. Because it reacts so quickly, the line often pins at 1 or 0 during a strong run; many traders treat a move back down through 0.8, or back up through 0.2, as the first sign the run is tiring.
The speed that makes it useful also makes it noisy on a low gamma, and an extreme reading in a trend can last for many bars. Treat a cross of the reference lines as a prompt to look at the price chart, not as a signal on its own.
Settings
- Gamma
- The damping factor from 0 to 1. Lower values make the line react faster and swing harder; higher values make it smoother and slower.
Frequently asked questions
Why is the scale 0 to 1 rather than 0 to 100?
The line is the share of the stage-to-stage movement that was upward, a fraction from 0 to 1. Multiply by 100 to read it as a percentage; the levels at 0.8, 0.5 and 0.2 are the usual 80, 50 and 20.
What does a reading of exactly 0.5 mean?
Either the rises and falls between the stages balance, or all four stages hold the same value, which happens on a flat market. The study reads 0.5 instead of dividing by zero.
What gamma should I use?
The default 0.5 is a middle ground. Drop toward 0.2 for a faster, choppier line on short trades, or raise toward 0.8 for a smoother line that ignores small swings.