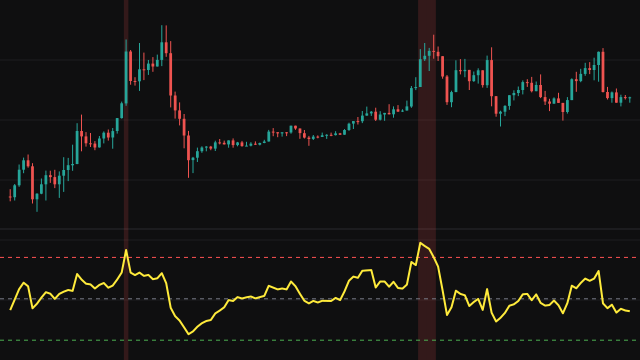
The Market Facilitation Index measures how efficiently volume moves price. For each bar it takes the distance from the high to the low and divides it by the bar's volume. A large reading means price travelled a long way on little trade; a small reading means a lot of trade moved price very little.
The calculation looks at one bar only, so there is no warmup and no setting. A bar that reports no volume, or a volume of zero, reads 0, which the study treats as no market activity rather than a gap in the line.
Because the value is a price distance per unit of volume, its size depends entirely on the instrument. On an instrument with large volume numbers the readings are tiny fractions, so compare the line with its own recent history rather than with a fixed threshold.
How to read MARKETFI: Market Facilitation Index
Read the line together with volume. A rising index on rising volume is an efficient move: more trade and more price change per unit of it, the shape of a trend with conviction. A falling index on rising volume is a squat bar, heavy trade that moved price very little, which often appears where buyers and sellers are fighting before a turn. A rising index on falling volume is a move with little participation behind it.
The index on its own says nothing about direction; a wide down bar and a wide up bar read the same. Use it to judge the quality of a move you can see on the price chart.
Frequently asked questions
Why are the values so small?
The index is a price range divided by volume. When volume runs into hundreds or thousands of units per bar the result is a small fraction. Its shape over time matters, not its absolute size.
Why does the line drop to 0 on some bars?
A bar with no reported volume, or a volume of zero, cannot be divided by, so the study reads 0 there to mark no market activity.
Does it show whether price is going up or down?
No. It uses the bar's range, which is the same size for an up bar and a down bar. Pair it with the price chart or a trend tool for direction.