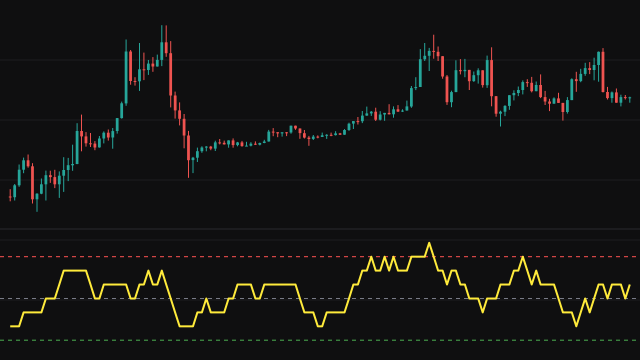
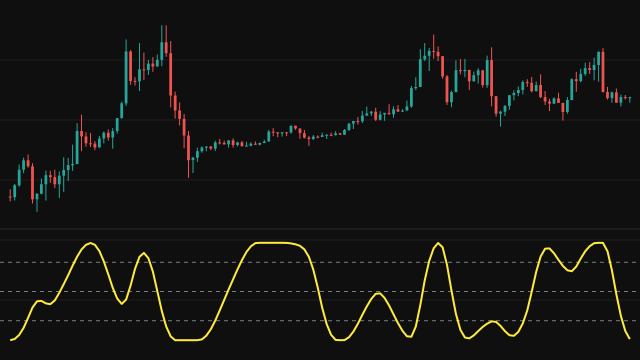
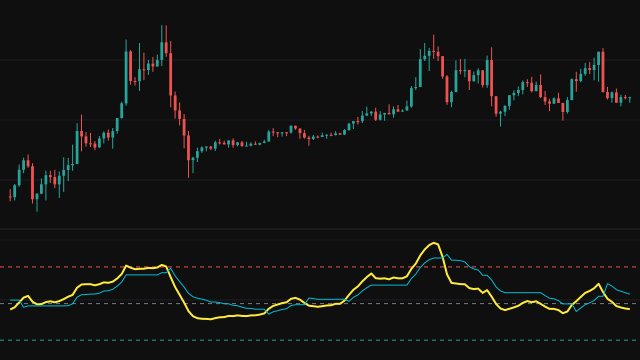
The Pretty Good Oscillator expresses the distance between the source and its moving average in units of volatility. It subtracts a simple average of the source from the source itself and divides the result by the average true range, both over the same period.
The simple average is taken over the bars seen so far until a full period has passed, so it answers from the first bar. The average true range is an exponential mean of true range with weight 1 / period, started at zero and divided by the weight still owed to that start while it matters, which keeps the first bars from reading too low. True range on the first bar is simply the high minus the low.
A reading of 2 means the source is two average bar ranges above its average. Because the scale is in volatility units it reads the same way on a quiet instrument and a volatile one. The pane is shaded red while the oscillator is above 3 and green while it is below minus 3.
How to read Pretty Good Oscillator
Around zero, price is close to its average and nothing is stretched. Readings above 3 say price has run unusually far above its average for the volatility it normally shows, and readings below minus 3 the same on the downside; the shading makes these stretches easy to spot. Some traders read a push beyond 3 as the start of a breakout, others as a move that is likely to snap back, and the price chart has to decide which.
The oscillator follows the average with a lag, and in a strong trend it can stay beyond 3 for a long stretch. A return through zero says price has come back to its average.
Settings
- Period
- The number of bars for both the simple average and the average true range. Longer periods give a slower average and a steadier range.
- Source
- The price series compared with its own average, the close by default.
Frequently asked questions
Why is the pane shaded on some bars?
Red shading marks bars where the oscillator is above 3, and green shading marks bars below minus 3: the two zones where price is stretched by more than three average bar ranges from its average.
Why divide by the average true range?
A plain price distance means different things on different instruments. Dividing by the average bar range turns it into a count of typical bars, so the same thresholds work across instruments and timeframes.
Does it answer from the first bar?
Yes. The average uses the bars seen so far until a full period exists, and the range is corrected for its zero start, so the line has no blank warmup.