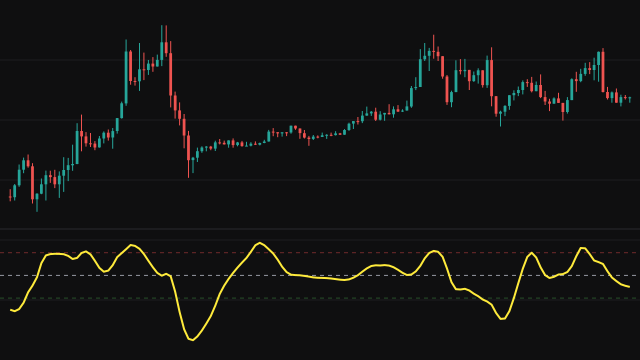
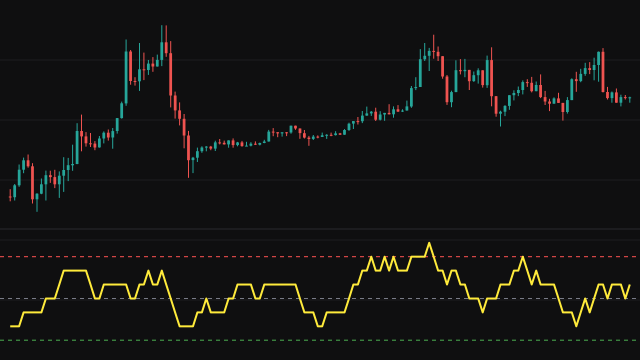
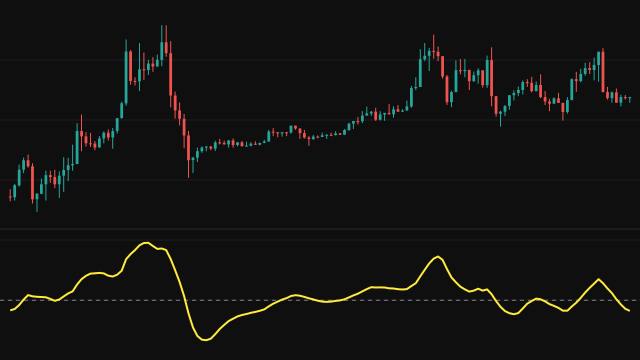
QQE starts with an RSI of the source, its gains and losses smoothed with weight 1 / RSI Period, and smooths it with an exponential mean of length Smooth Factor. That smoothed RSI is the yellow QQE line.
The study then measures how much the QQE line moves from bar to bar. It takes the absolute change of the line and smooths it twice with an exponential mean of length 2 x Smooth Factor - 1, which gives a dynamic average range. Multiplying that range by the QQE Factor sets a band above and below the line.
The trailing level follows the band like a stop. While the line and its previous reading are both above the trailing level, the level can only rise toward the lower band; while both are below, it can only fall toward the upper band. When the line crosses it, the trailing level jumps to the band on the other side. Every smoothing stage starts at zero and is divided by the weight still owed to that start, so both lines answer from the first bar.
How to read Quantitative Qualitative Estimation (QQE)
Watch the QQE line against the trailing line. A cross of the QQE line above the trailing line says momentum has turned up by more than its usual noise; a cross below says it has turned down. The levels at 70, 50 and 30 give the usual RSI context: a cross up from below 30, or a cross down from above 70, comes from a stretched reading.
The band width adapts to how much the RSI has been moving, so in choppy conditions the trailing line sits further away and crosses are rarer. A larger QQE Factor widens the band and gives fewer, later crosses.
Settings
- Source
- The price series the RSI is computed from, the close by default.
- RSI Period
- The length of the RSI. A shorter period makes the RSI and everything built on it faster and noisier.
- Smooth Factor
- The length of the exponential mean applied to the RSI; the range smoothing uses twice this minus one. Higher values give smoother lines.
- QQE Factor
- The multiple of the dynamic average range used to place the trailing band. Larger values keep the trailing line further away and give fewer crosses.
Frequently asked questions
What is the trailing line?
A level that follows the QQE line at a distance set by the line's own recent volatility. It only moves toward the line while the line stays on one side, and jumps to the other side when the line crosses it, much like a trailing stop.
Why does the trailing line jump?
When the QQE line crosses it, the trailing level flips from the band below the line to the band above it, or the reverse. The jump marks the bar where momentum changed side.
Is the QQE line the same as an RSI?
It is an RSI smoothed with an exponential mean, so it follows the same 0 to 100 scale with less noise and a little more lag.