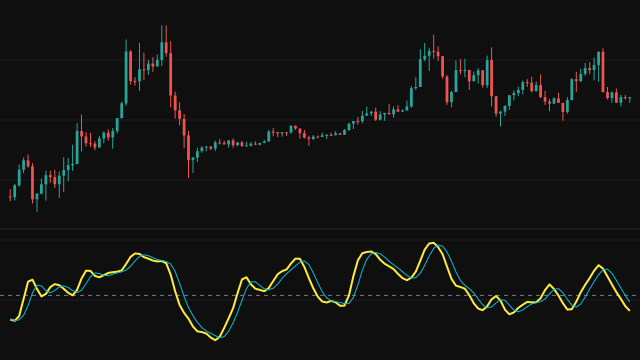
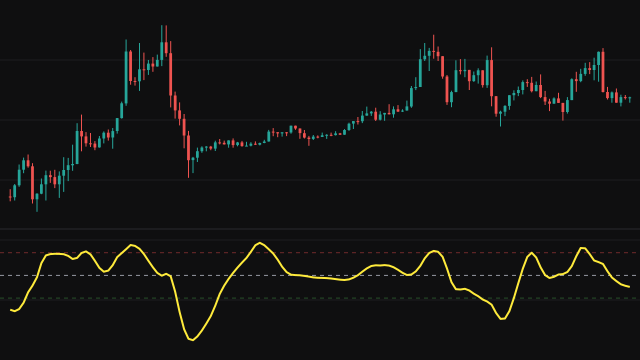
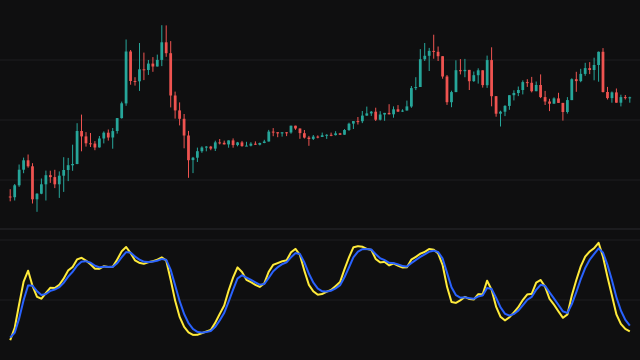
This study starts from an ordinary exponential moving average of the source with weight 2 / (period + 1). While the average is filling it is divided by the weight it has gathered so far, so the first values are not dragged toward the zero it starts from.
The average is then passed through eight cascaded reverse stages. Each stage takes the stage below it, multiplies it by the decay factor (1 minus the weight) raised to a doubling power (1, 2, 4 up to 128), and adds the previous bar's value of the stage below. Together the stages approximate the inverse of the exponential filter. The plotted value is the average minus the weight times the last stage, which leaves a line centred on zero.
All eight stages start from zero, and each one reads the stage below it one bar late, so the cascade takes eight bars to fill. Until then the last stage is far too small, and the line opens near the level of the price itself before it drops into its normal range around zero. A missing source value enters the calculation as zero and is blanked on the plot, but the state still moves forward on that bar.
How to read Ehlers Reverse EMA (REVERSEEMA)
Treat the line as a smoothed momentum reading. Above zero, the recent smoothed price is running ahead of what the reversed filter expects; below zero it is falling behind. Crossings of zero and turns from an extreme are the events most traders watch, often together with the trend of the price itself.
The size of the swings depends on the instrument's price, so compare the line with its own history rather than with a fixed number. A short period reacts quickly and turns often; a long period is calmer and slower.
Settings
- Period
- The length of the base exponential average. A longer period gives a smoother, slower oscillator.
- Source
- The price series the average is taken over.
Frequently asked questions
Why are there eight reverse stages?
Each stage doubles the power of the decay factor, so eight stages reach a power of 128, by which point the factor is effectively zero for any usual period and further stages change nothing.
Is the value in price units?
Yes. It is a difference between two price-based quantities, so its scale follows the instrument's price. Use the zero line and the turns rather than a fixed threshold.
Why does the line start near the price and then collapse?
The reverse stages start from zero and each one reads the stage below it one bar late, so the last stage is not complete until the ninth bar. Before that, little is subtracted from the average and the line reads close to the price itself. Ignore those opening bars, and with a long period the stretch after them as well, while the stages settle.