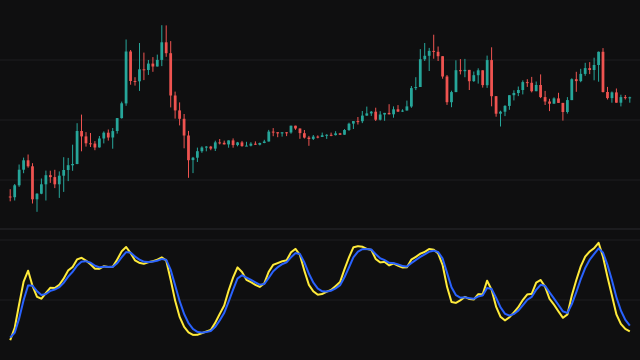
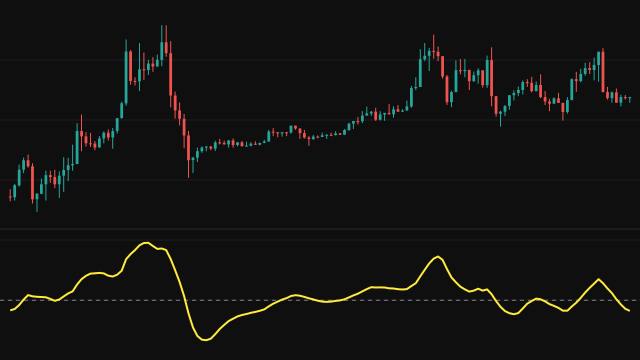
The Relative Vigor Index asks how much of each bar's range was covered in the direction of the close. For every bar it takes the close minus the open and the high minus the low. Each series is smoothed with symmetric four-bar weights of 1, 2, 2 and 1, so the newest bar and the bar three back count once and the two in between count twice. A bar before the first one counts as zero.
The smoothed close-minus-open is averaged over the last period bars, and so is the smoothed range, using the bars seen so far until a full period exists. The index is the first average divided by the second, and reads 0 when the range average is zero.
The signal line applies the same 1, 2, 2, 1 weights to the index itself. Both lines answer from the first bar.
How to read Relative Vigor Index (RVGI)
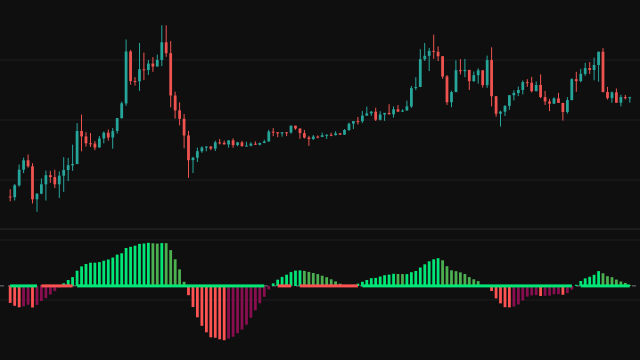
Above zero, bars have been closing above their opens on average, a sign of buying vigour; below zero, closing below their opens. The further from zero, the more of each bar's range the closes have covered. A cross of the index above its signal line says the vigour is improving, and a cross below says it is fading.
The lines are smoothed and so lag price by a few bars, and in a sideways market they cross often. Many traders look for the crosses that come after a stretched reading, or for a divergence where price makes a new high or low that the index does not confirm.
Settings
- Period
- How many bars the smoothed close-minus-open and the smoothed range are averaged over. Longer periods give a smoother, slower index.
Frequently asked questions
What do the weights 1, 2, 2, 1 do?
They smooth each series over four bars while giving the two middle bars double weight. The result sits one and a half bars behind the newest bar, and it cancels completely a swing that alternates every bar or repeats every three bars.
What does a cross of the signal line mean?
The signal line is a short weighted average of the index. When the index crosses above it, recent vigour is stronger than over the last few bars; when it crosses below, it is weaker.
Why does it answer from the first bar?
Missing earlier bars count as zero in the four-bar weights, and the averages use the bars seen so far until a full period exists, so the line has no blank warmup.