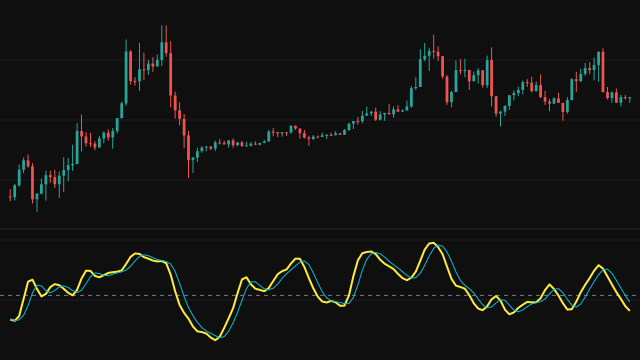
The Stochastic Momentum Index measures the distance from the source to the middle of the recent range rather than to its low. It finds the highest high and lowest low of the last %K Period bars, takes their midpoint and half their distance, and expresses the source's distance from the midpoint as a percentage of that half range. The result runs from about minus 100 at the low to plus 100 at the high.
With the Blau Method switch on, that ratio is smoothed twice with an exponential mean of length %K Smooth to give %K. With it off, the distance and the half range are each smoothed twice first and then divided, which weights wide-range bars more heavily. In both cases %D is an exponential mean of %K with length %D Smooth.
Every exponential stage starts at zero and, while any stage still owes weight to that start, is divided by the weight it has earned, so the lines answer from the first bar. Until %K Period bars exist, the range uses the bars seen so far.
How to read Stochastic Momentum Index (SMI)
Above zero the source is in the upper half of its recent range, below zero in the lower half. Readings above 40 are often treated as overbought and below minus 40 as oversold, though the exact lines vary with the settings. A cross of %K above %D is a sign of improving momentum, and a cross below of weakening momentum; a cross of zero says price has moved to the other half of its range.
The double smoothing makes the SMI steadier than a plain stochastic but also later to turn. In a strong trend it can stay on one side of zero for a long time.
Settings
- %K Period
- How many bars the high-low range covers. A longer window gives a wider range and calmer readings.
- %K Smooth
- The length of both exponential smoothing passes that produce %K. Higher values give a smoother, slower line.
- %D Smooth
- The length of the exponential mean of %K that forms the %D signal line.
- Source
- The price series compared with the range midpoint, the close by default.
- Blau Method
- On: smooth the ratio itself. Off: smooth the distance and the half range separately and divide afterwards, so wide-range bars count for more.
Frequently asked questions
How is the SMI different from a stochastic?
A stochastic measures from the low of the range, so it runs 0 to 100. The SMI measures from the midpoint, so it runs from about minus 100 to plus 100 and its sign tells you which half of the range price is in.
What does the Blau Method switch change?
Whether the ratio is smoothed (on) or the distance and the half range are smoothed apart and then divided (off). The second way gives bars with a wide range more say in the result.
Why does it start without a blank warmup?
Each smoothing stage is corrected for starting at zero, and the range uses the bars seen so far until the window fills, so both lines have values from the first bar.