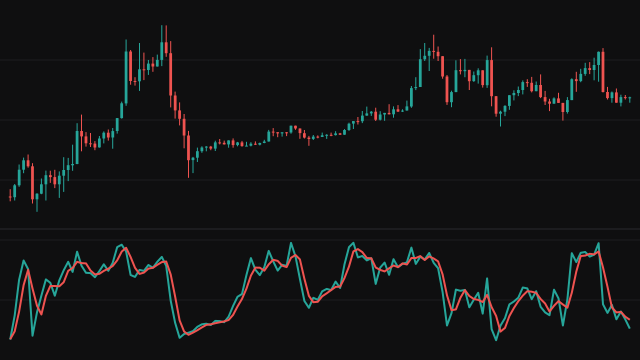
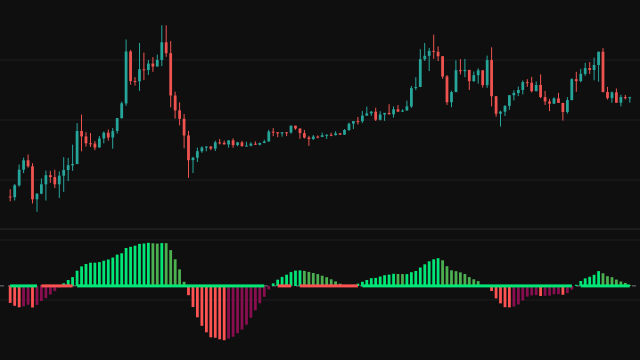
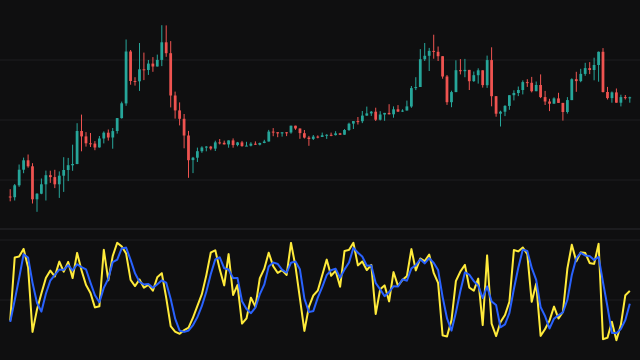
The Schaff Trend Cycle starts with a MACD line: a fast exponential mean of the source minus a slow one. Each mean uses weight 2 / length, passes the first value straight through, and is corrected for its zero start until that correction no longer matters.
The MACD line is then scaled like a stochastic. The study finds its highest and lowest value over the last Cycle Length bars and places the current value in that range from 0 to 100, reading 0 until the window is full or when the range is flat. That result is smoothed with a three-bar exponential mean, and the same stochastic scaling is applied a second time.
The last step depends on the Smoothing setting. 0 shows the second stochastic as it is, 1 smooths it again with a three-bar exponential mean, 2 passes it through a sigmoid curve centred on 50, and 3 latches the line to 100 above 75 and to 0 below 25, holding the last value in between.
How to read Schaff Trend Cycle (STC)
The line spends most of its time near the top or the bottom of the scale and moves quickly between them. A rise from below 25 says the MACD has turned up relative to its recent range, an early sign of an upswing; a fall from above 75 says it has turned down. With the digital setting the line is simply on or off, which some traders use as a trend filter.
Because both stochastic steps stretch small changes in the MACD to the full scale, the line can flip on modest moves in a quiet market. Read its turns in the direction of the larger trend.
Settings
- Source
- The price series the MACD is built from, the close by default.
- Cycle Length
- The window for both stochastic steps. A shorter cycle makes the line faster and more prone to flipping.
- Fast Length
- The length of the fast exponential mean in the MACD. Shorter values make the MACD react sooner.
- Slow Length
- The length of the slow exponential mean in the MACD. Longer values make the MACD reflect a longer trend.
- Smoothing
- The final step: 0 none, 1 a three-bar exponential mean, 2 a sigmoid curve centred on 50, 3 a digital latch to 100 above 75 and 0 below 25.
Frequently asked questions
Why does the line flatten at the top and bottom?
Each stochastic step places its input in that input's recent range, so a step reads 100 or 0 whenever its input is at a new high or low for the window, and the second step often stays there for several bars. The default sigmoid finish turns those ends into about 99.3 and 0.7 and compresses readings near them, while it steepens the middle of the scale.
What does the digital setting do?
It turns the line into a switch: 100 once the second stochastic rises above 75, 0 once it falls below 25, and the previous value in between. Before the first switch it has no value.
How is it different from a MACD?
It uses the same MACD line but rescales it twice to a 0 to 100 range, so it turns sooner and reads on a fixed scale, at the cost of more false turns in a quiet market.