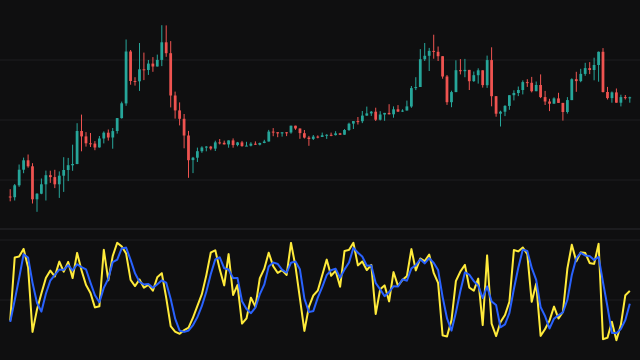
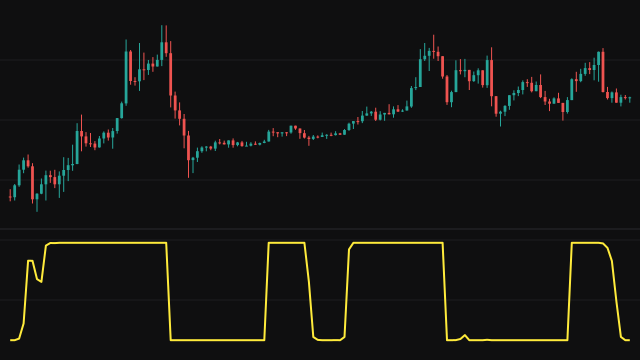
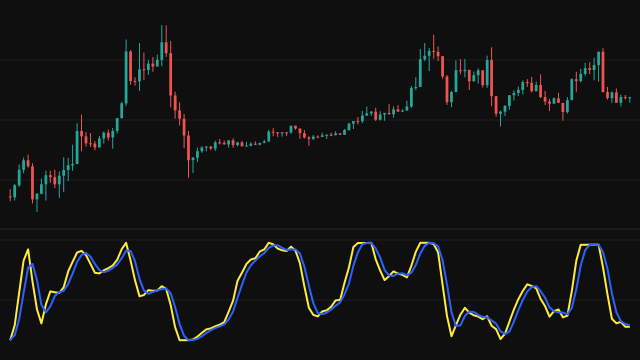
The Stochastic Oscillator asks where the close sits in its recent range. It finds the lowest low and highest high of the last K Length bars and works out how far up that range the close is, from 0 at the low to 100 at the high. That is the %K line. When the range is flat, %K reads 0. Until K Length bars exist, the range uses the bars seen so far.
The %D line is the simple mean of %K over the last D Smooth bars. On the first bar every slot of that average is filled with the first %K, and each later bar replaces the oldest slot, so %D answers from the first bar and settles into an ordinary moving average once the window has turned over.
A missing high or low is read as 0.
How to read Stochastic Oscillator (STOCH)
A high reading means the close is near the top of its recent range and a low one near the bottom. Above 80 is usually read as overbought and below 20 as oversold, but in a trend the line can hold in those zones for many bars, and that persistence is itself a sign of strength. A cross of %K above %D is read as an early upturn, a cross below as an early downturn.
The raw %K line is quick and noisy, and in a sideways market the two lines cross often. Divergence, where price makes a new extreme that the oscillator does not, is a common way to read it.
Settings
- K Length
- How many bars the high-low range covers. A shorter window makes %K faster and noisier.
- D Smooth
- How many %K readings the %D line averages. A longer average gives a smoother, slower signal line.
Frequently asked questions
What do the two lines mean?
%K is the close's position in its recent range. %D is a simple average of %K and acts as a signal line; crosses between the two are the usual signals.
Why does %D start at the same value as %K?
On the first bar every slot of the average holds the first %K, so %D equals it. As later bars arrive they replace the slots one at a time.
Is a reading above 80 a sell signal?
Not on its own. It says the close is near the top of its recent range, which is also what a strong uptrend looks like. Many traders wait for the line to fall back below 80 or for a cross of %D.