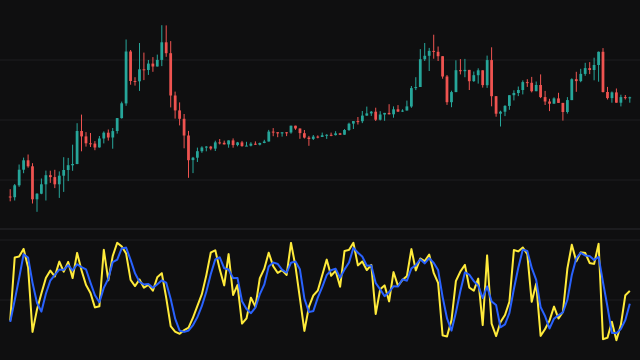
The Stochastic RSI first computes an RSI of the source. The up and down moves against the previous bar are smoothed with weight 1 / RSI Length; for the first RSI Length bars the smoothed move is simply that bar's move, so on those bars the RSI reads 100 when the source did not fall and 0 when it fell. The bar before the first one reads as 0, so the very first move is the whole source value.
It then finds the highest and lowest RSI over the last Stochastic Length bars and places the current RSI in that range from 0 to 100, reading 50 when the range is flat. That raw value is averaged over %K Smooth bars to give %K, and %K is averaged over %D Smooth bars to give %D.
Every window uses the bars seen so far until it is full, so both lines answer from the first bar.
How to read Stochastic RSI (STOCHRSI)
The line shows whether the RSI is near the top or the bottom of its own recent range. It moves much faster than the RSI and spends a lot of time pinned near 0 or 100. Readings above 80 are usually read as overbought and below 20 as oversold; a cross of %K above %D from low readings is read as an upturn, and a cross below from high readings as a downturn.
Because it is a stochastic of an indicator rather than of price, small changes in the RSI can swing it across the full scale. Use it for timing inside a trend you have identified another way, not as a trend signal in itself. Ignore the start of the chart: for the first RSI Length bars the RSI is only ever 100 or 0, and those readings stay in the stochastic window for Stochastic Length bars after that.
Settings
- RSI Length
- The length of the RSI the stochastic is applied to. Shorter values make the RSI, and so the whole study, faster.
- Stochastic Length
- How many RSI readings the high-low range covers. A shorter window makes the line swing more.
- %K Smooth
- How many raw stochastic readings are averaged into %K. Higher values smooth out the jumps.
- %D Smooth
- How many %K readings are averaged into the %D signal line.
- Source
- The price series the RSI is computed from, the close by default.
Frequently asked questions
Why does it hit 0 and 100 so often?
It measures the RSI against its own recent range, so every time the RSI makes a new high or low for the window the raw value is 100 or 0. Only the smoothing keeps %K and %D off the extremes.
Why does it read 50 on some stretches?
When the RSI has not changed across the whole window, its range is zero and the stochastic reads 50, the middle of the scale.
Why do the first bars look odd?
For the first RSI Length bars the smoothed up and down moves are just that bar's own move, so the RSI reads 100 on any bar that did not fall and 0 on a bar that fell, and the first bar compares the price with 0. The smoothing starts only after that, and the extreme readings stay in the stochastic window for another Stochastic Length bars, so the line settles after roughly RSI Length plus Stochastic Length bars.