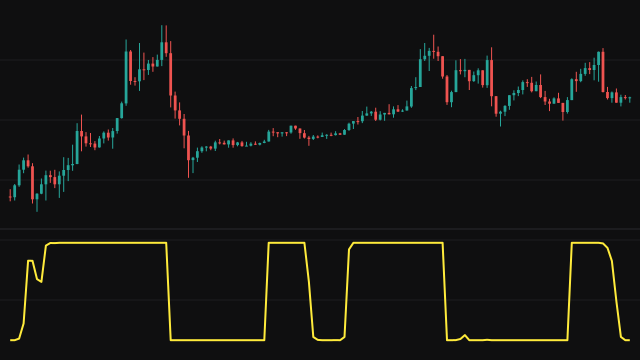
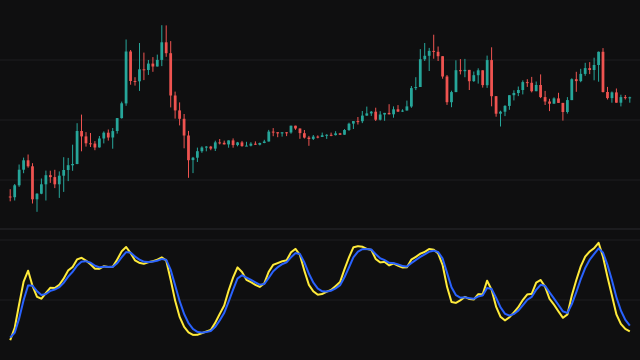
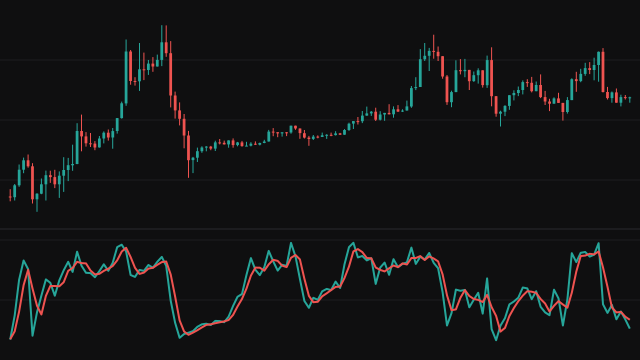
Note. The Squeeze On and Squeeze Off states are drawn as red and green line segments along zero rather than as separate dots, because a plot in this OpenScript version has no dots-only style.
Squeeze Momentum combines a volatility test with a momentum reading. The test compares two envelopes of the same period. The Bollinger Bands are the simple mean of the source plus and minus BB Multiplier population standard deviations. The Keltner Channel is an exponential mean of the source plus and minus KC Multiplier times an average true range smoothed with weight 1 / period. The squeeze is on while the Bollinger Bands sit wholly inside the channel, which happens when the source has stayed in a tight cluster over the period compared with the size of the average bar range.
The momentum histogram is a least squares line fitted through the last period values of a distance: the source minus the average of two midpoints, the Donchian midpoint of the period's highest high and lowest low, and the simple mean. The histogram plots that line's value at the current bar.
Every window uses the bars seen so far until a full period exists, and both exponential means are corrected for their zero start, so the study answers from the first bar. The histogram is bright green while positive and rising, darker green while positive and falling, red while negative and falling, and maroon while negative and rising.
How to read Squeeze Momentum (SQUEEZE)
The red line along zero marks bars in a squeeze, and the green line marks bars out of one. A squeeze says volatility has contracted; a quiet stretch like this is often followed by a wider move, though not always. When the squeeze ends, the histogram's side of zero suggests the direction of that move, and its colour shows whether momentum is still building or already fading.
The squeeze says nothing about when the release will come, and a release can fail and fold back. Some traders wait for the squeeze to end and the histogram to agree before acting, and take the change from bright to dark colour as the first sign a move is losing pace.
Settings
- Source
- The price series used for the means, the deviation and the momentum, the close by default.
- Period
- The window shared by the bands, the channel, the Donchian range and the regression. Longer periods give slower, steadier readings.
- BB Multiplier
- How many standard deviations the Bollinger Bands sit from their mean. A larger value makes a squeeze rarer.
- KC Multiplier
- How many average true ranges the Keltner Channel sits from its mean. A larger value makes a squeeze more common.
Frequently asked questions
What are the two lines along zero?
They show the squeeze state. The red line is drawn on bars where the Bollinger Bands are inside the Keltner Channel, and the green line on bars where they are not, so the colour along zero tells you which state each bar is in.
What do the four histogram colours mean?
Bright green: positive and higher than the bar before. Dark green: positive but lower. Red: negative and lower than the bar before. Maroon: negative but higher. The dark shades show momentum fading toward zero.
How is the momentum value worked out?
It fits a straight line through the last period values of the source minus the average of the Donchian midpoint and the simple mean, and reads that line at the current bar. This smooths the distance with less lag than a plain average of the same window.