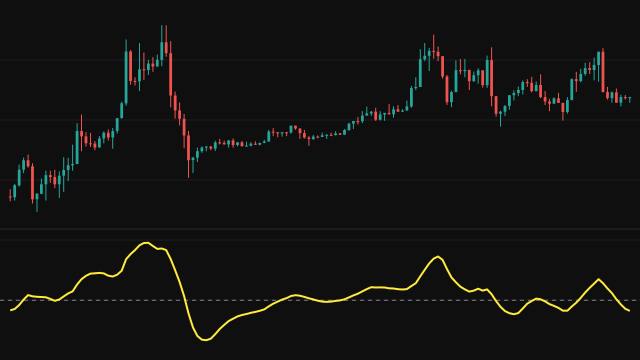
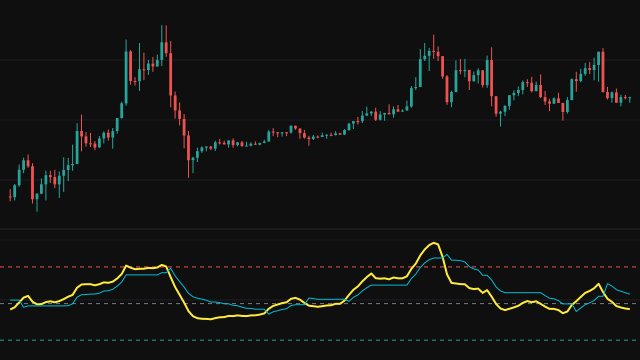
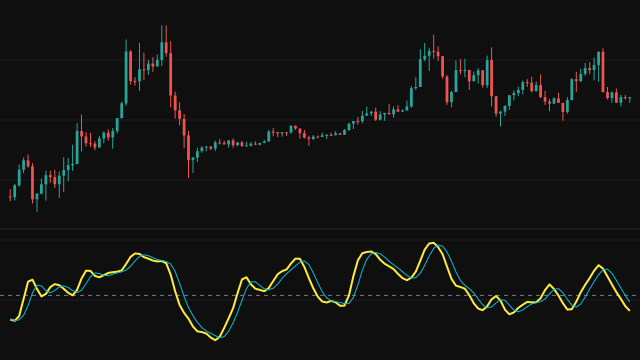
REFLEX looks for the turning points of price cycles. It first smooths the source with a two-pole filter tuned to half the period, which removes most of the bar-to-bar noise while keeping the cycle. It then draws a straight line from the filtered value one period ago to the filtered value now and averages the gap between that line and the filtered series at every bar in between.
When price travels in a straight line the gap is close to zero. When it bends, rising and then falling or the reverse, the filtered series bows away from the line and the average gap grows. That gap is divided by the square root of an exponential mean of its own square (a running root mean square with a weight of 0.04), so the result reads roughly in units of its own recent spread, and the same levels mean the same thing on any instrument.
The filter and the mean square start from zero, and the line reads zero until a full period of filtered values exists. On the first bar with a reading the mean square holds only that one value, so the line opens at plus or minus 5 and then settles, which makes the opening stretch a warmup rather than a reading.
How to read Ehlers Reflex Indicator (REFLEX)
Read REFLEX as a cycle gauge around zero. A move above +1 says the smoothed price has bowed upward further than usual compared with its recent behaviour, and a move below -1 says the same downward. Turns of the line from beyond those levels are the moments the cycle is rolling over, and crossings of zero mark the middle of a swing.
It is built to follow cycles, not trends. In a long, steady trend the line drifts back toward zero because a straight move has nothing to reflect, so a quiet reading does not mean the market is quiet. Very short periods make it jumpy, and very long ones make it slow to turn.
Settings
- Period
- The cycle length in bars. The smoothing filter is tuned to half of it, and the straight line and the averaged gap both span this many bars.
- Source
- The price series the indicator reads. A missing value enters the filter as zero.
Frequently asked questions
What do the +1 and -1 levels mean?
The output is divided by a running root mean square of itself, so plus and minus one are roughly one unit of its own recent spread. Readings beyond them are larger bends than the line has been showing lately.
Why is the line flat at zero and then jumps to 5?
The averaged gap needs a full period of filtered values, so until the period has passed it is held at zero. The running mean square also starts from zero, so on the first bar with a gap it equals 0.04 times that gap squared, and the gap divided by its square root is exactly plus or minus 5. The line then settles over the following bars.
How is it different from a trend gauge built on the same filter?
This one measures the gap to a straight line through the window, which removes the trend and leaves the bend. A trend gauge measures the gap to each past value directly, so it keeps the trend in.