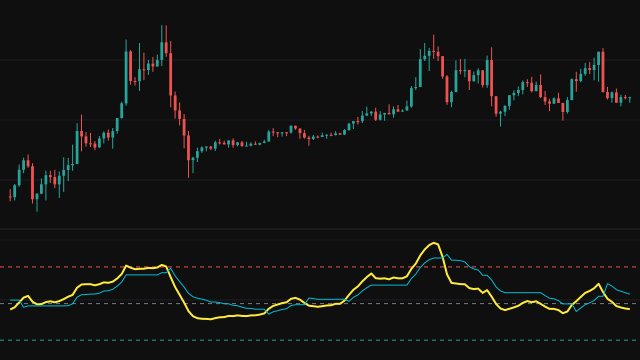
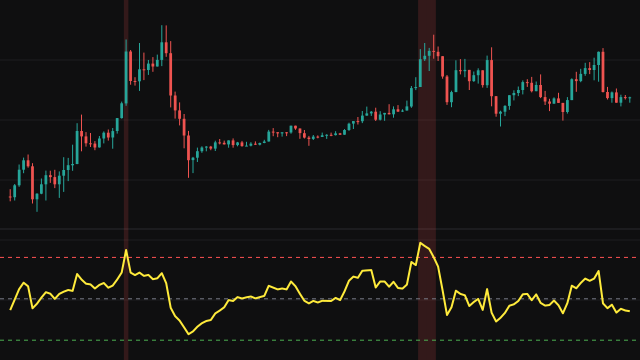
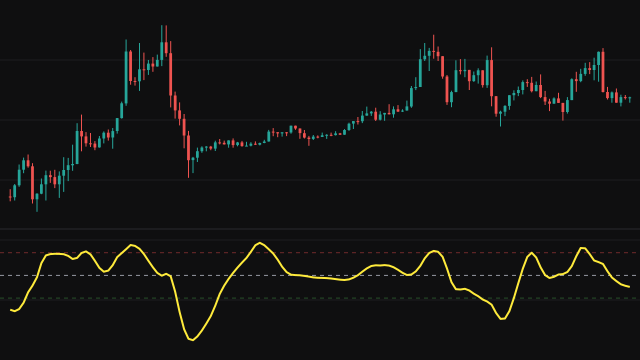
The Psychological Line counts how many of the recent bars closed up. A bar counts as up when its source value is higher than the previous bar's; an equal or lower value counts as not up. The study adds up the up bars over the last period bars and expresses the count as a percentage of the bars in the window.
Until a full period of bars has been seen, the percentage is taken over the bars that exist, so the line answers from the first bar. The first bar has no previous bar to compare with and never counts as up.
Because it is a share of a count, the line always sits between 0 and 100. With the default period of 12 it moves in steps of about 8.3, one step for each bar that enters or leaves the window.
How to read Psychological Line (PSL)
A reading above 50 says more of the recent bars closed up than not; below 50, more closed flat or down. The dashed lines at 75 and 25 mark the stretched readings the study is usually watched for: at 75 or more, three quarters of the recent bars rose, which some traders read as a crowd leaning too far one way, and at 25 or less the reverse.
The count ignores how far each bar moved, so a run of small up bars can read high while price has gone nowhere. Use it as a gauge of mood alongside the price chart.
Settings
- Period
- How many recent bars are counted. A short period makes the line jumpy; a long one makes it slower and closer to 50.
- Source
- The price series compared bar to bar to decide which bars count as up, the close by default.
Frequently asked questions
Why does the line move in steps?
It is a count divided by the window length, so it can only take a fixed set of values. With a period of 12 each up bar is worth about 8.3 points.
Does a flat bar count as up?
No. Only a bar whose source is strictly higher than the previous bar's counts as up; an unchanged bar counts with the down bars.
Can it go beyond 0 or 100?
No. It is the share of bars that rose, so it is always between 0 and 100.