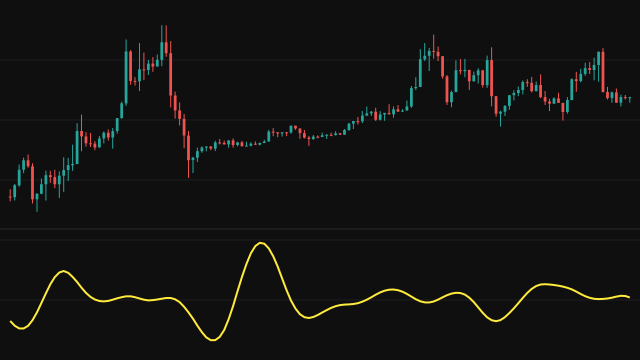
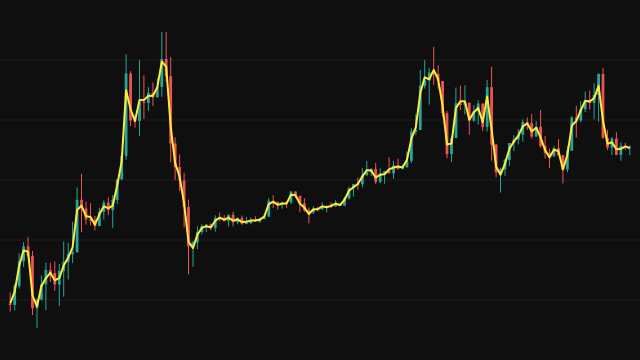
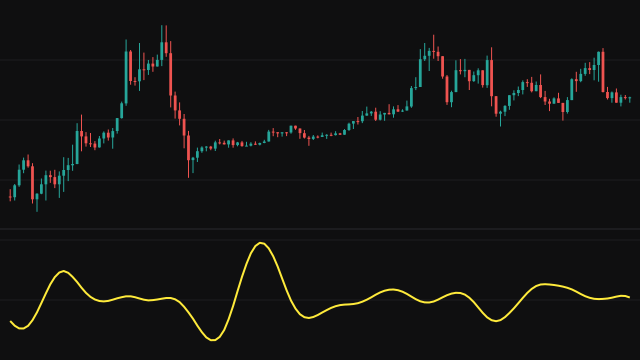
This study takes the last N bars of the source, tapers them with a Hann window, and splits them into frequency components with a Fourier transform. It keeps only the constant (DC) term and the lowest harmonics components, throws the faster ones away, and sums what is left back into a single value for the current bar. The result is a low-pass filtered version of price drawn on the chart.
Because both the forward transform and the rebuild run over the same windowed samples, the whole calculation reduces to one weighted sum of the last N bars, with a fixed weight per lag: the Hann taper times 1 + 2 * sum(cos(2 * pi * k * n / N)) over the kept harmonics, divided by N. The study builds those weights once and applies them on every bar. Bars before the first one count as zero, so the line answers from the first bar but only settles once N bars of history exist.
How to read Inverse Fast Fourier Transform (IFFT)
Read the line as the slow shape of price. Fewer harmonics give a smoother line that follows only the broad swings, while more harmonics let it follow shorter cycles more closely. A larger window gives finer frequency resolution, so each kept harmonic describes a longer cycle.
The Hann taper weights the middle of the window most and gives the current bar a weight of zero, so the line describes the window as a whole rather than the newest bar, and it lags turns in price. During the first N bars the window is padded with zeros, so the line starts near zero and climbs towards price; ignore that stretch.
Settings
- Source
- The series that is transformed and rebuilt.
- Window Size
- How many bars enter the transform: 32, 64 or 128. Any other value is read as 64. A larger window resolves longer cycles and gives a smoother line.
- Harmonics
- How many of the lowest-frequency components are kept, up to half the window. Fewer harmonics give a smoother line.
Frequently asked questions
Why does the line start near zero?
Bars before the first one count as zero, so for the first N bars the window is partly empty and the weighted sum is too small. The line is meaningful once N bars of history exist.
Why does the window accept only 32, 64 or 128?
The transform is set up for those three sizes. Any other value falls back to 64.
Is this a forecast?
No. Every value is built from the current and past bars only, and a value never changes once its bar has closed.