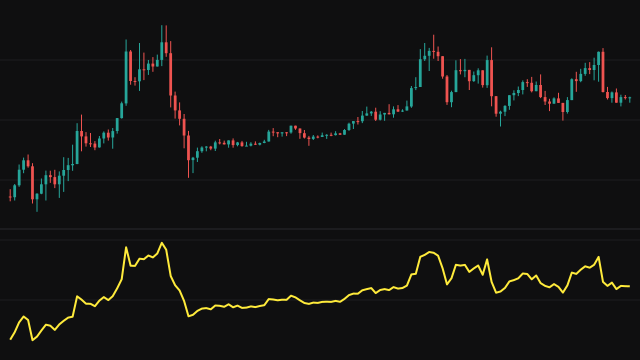
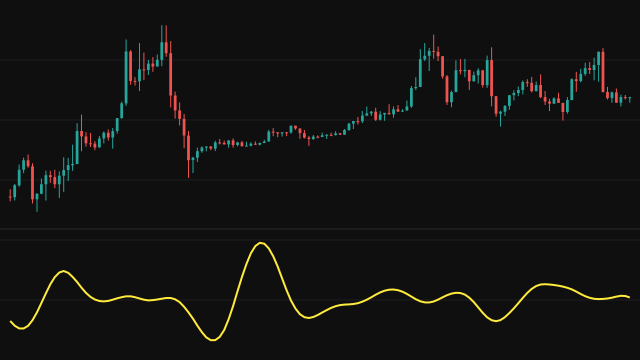
Jolt is built from three nested rolling regressions over the same lookback. The first fits a straight line to the source over the last Period bars and takes its slope. The second fits a line to that slope series to give acceleration, the curvature of the trend. The third fits a line to the acceleration and plots its slope, the rate at which the curvature changes.
Each fit is a rolling least squares line over the last Period bars, where the x value is the bar number. The sums behind it are kept as running totals: each bar adds the newest point and removes the one that left the window. A bar whose value is absent still takes its place in the window but adds nothing to the sums, and a slope needs at least two valid points.
Each stage needs two values from the stage before it, so the jolt line begins on the fourth bar of the chart.
How to read Acceleration, Slope of Slope (JOLT)
Positive jolt means the trend's acceleration is increasing, negative means it is decreasing. A swing of jolt through zero marks a peak or trough in acceleration, which usually comes before the slope and then the price turn. Use it as an early hint that a move is changing character, and confirm it with the slope or with price.
Because it is a third difference, jolt is noisy and its values scale with the instrument's price. Longer periods give a steadier line; very short ones mostly show noise.
Settings
- Period
- The lookback used by each of the three least squares slope passes. A longer period smooths every stage.
- Source
- The price series the first slope is fitted to, the close by default.
Frequently asked questions
Is jolt the same as jerk?
It is the same calculation: three chained least squares slopes over one lookback. The two names describe the third derivative of price with respect to time.
Where does the line start?
On the fourth bar. The first fit needs two bars, the second needs two slopes and the third needs two acceleration values.
Should I trade its zero crossings alone?
No. A third derivative turns often and early. Its crossings are best used as a warning that the trend's curvature is changing, read together with the trend itself.