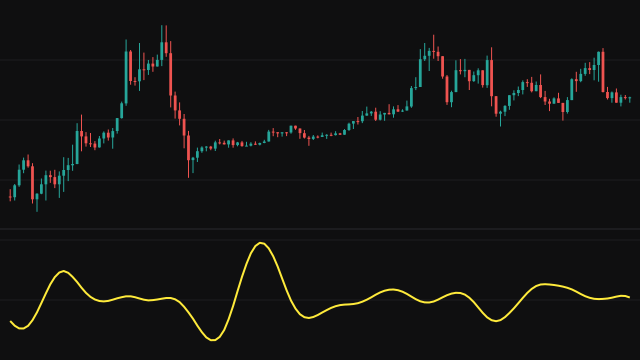
The Linear Transformation applies y = a * (x - average) + average + b to the source on every bar. The average is a simple moving average of the source over smaPeriod bars. The scale a multiplies the distance between the source and that average, and the offset b moves the whole result up or down.
With a above 1 every swing away from the average is exaggerated, with a between 0 and 1 it is damped, and with a negative a the series is mirrored about its average. The average itself is never moved except by the offset. While fewer than smaPeriod bars exist, the average is taken over every bar so far, so the line answers from the first bar.
How to read Linear Transformation (LINEAR)
Read the line as the source with its deviations from the mean scaled by a and then shifted by b. Where the source crosses its average the transformed line passes through the average plus b. Where the source is far from its average, the transformed line is a times as far.
The study adds no new information about direction; it reshapes the series so that small departures from the mean are easier or harder to see. During the first smaPeriod bars the average is built from a shorter history, so values there are less settled than later ones.
Settings
- Source
- The series that is rescaled about its own moving average.
- SMA Period
- How many bars the moving average covers. A longer average is smoother, so more of the price movement counts as deviation.
- Scale (a)
- Multiplies the distance between the source and its average. Above 1 stretches swings, between 0 and 1 damps them, and below 0 mirrors them.
- Offset (b)
- A constant added to every value, which moves the whole line up or down without changing its shape.
Frequently asked questions
What happens with a scale of 1 and an offset of 0?
The output equals the source exactly, because the distance from the average is added back unchanged.
Why does the line start on the first bar?
Until smaPeriod bars exist, the average is taken over every bar seen so far, so there is always an average to scale around.
What does a negative scale do?
It mirrors the series about its moving average: a bar above the average is plotted the same distance below it, times the size of the scale.