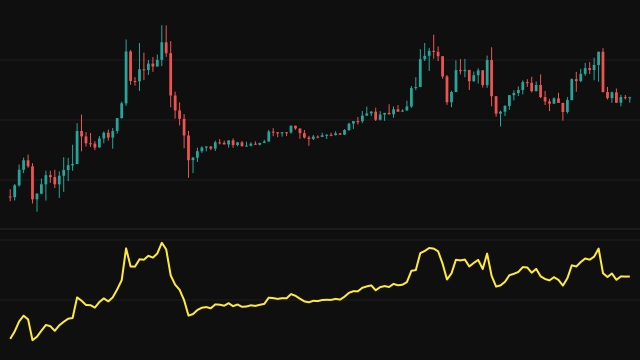
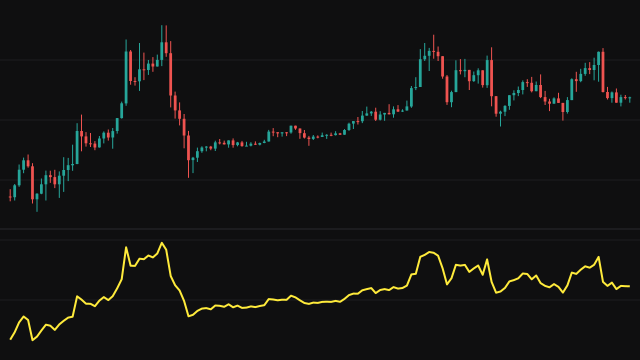
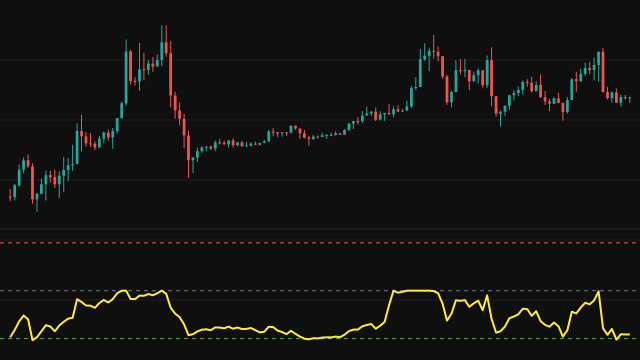
This Linear Transformation rescales a series about its own simple moving average. On every bar it computes the average of the source over period bars, takes the distance between the source and that average, multiplies the distance by the scale a, adds the average back and finally adds the offset b.
The result changes how large the swings around the average look: a scale above 1 exaggerates them, a scale between 0 and 1 shrinks them towards the average, and a negative scale flips them to the other side. While fewer than period bars exist, the average is taken over every bar so far, so the line has a value from the first bar.
How to read Linear Transformation (LINEAR)
Treat the line as a reshaped copy of the source. Its distance from the average plus b is always a times the source's distance from the average. Because the average moves too, a peak or trough of the line can fall on a different bar from the matching turn in the source when a is not 1. A large scale makes small departures from the mean easy to see, and a small scale keeps the line close to the trend.
The offset is useful for placing the line where it does not overlap another study in the same pane. The first period bars use a shorter average, so those values settle as more history arrives.
Settings
- Source
- The series that is rescaled about its own moving average.
- SMA Period
- How many bars the moving average covers. A longer period gives a slower average and larger deviations to scale.
- Scale (a)
- Multiplies the distance from the average. Values above 1 stretch the swings, values between 0 and 1 damp them, and negative values mirror them.
- Offset (b)
- A constant added to every bar, shifting the whole line up or down without changing its shape.
Frequently asked questions
What happens with a scale of 1 and an offset of 0?
The output equals the source exactly, because the distance from the average is added back unchanged. With a scale of 0 the output is the average plus the offset.
How is the average built during the first bars?
Until period bars exist, it is the mean of every bar seen so far. After that it is the ordinary simple moving average of the last period bars.
What is the offset for?
It shifts the line by a fixed amount, which keeps it apart from other lines in the same pane or lets it sit on a chosen reference level.