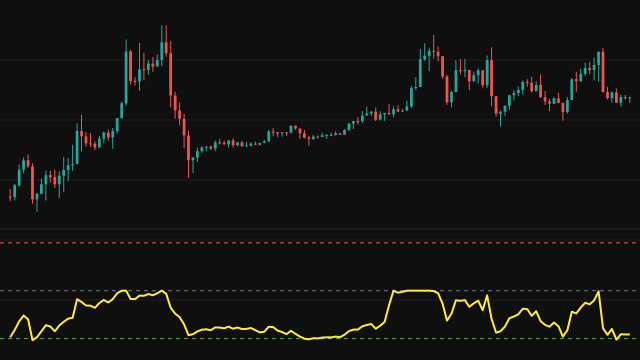
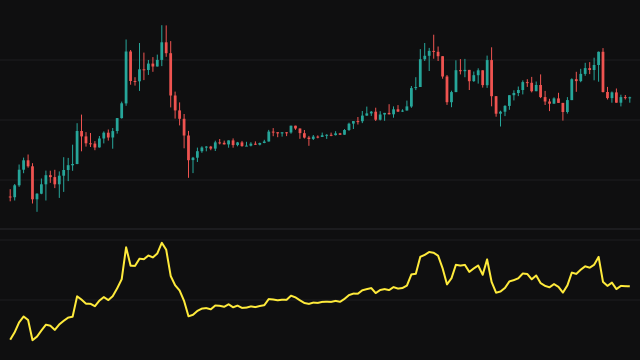
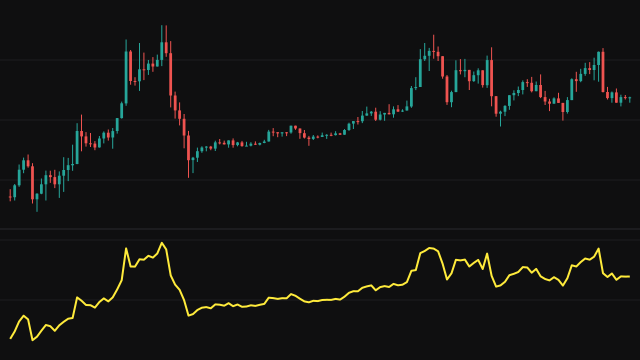
The Logarithmic Transformation takes the natural logarithm of the chosen source on every bar and plots it in a separate pane. On a log scale a move from 100 to 110 covers the same height as a move from 1,000 to 1,100, because both are ten percent. A series that compounds at a steady rate becomes a straight line.
The calculation is a single step: ln(source). The logarithm only exists for values above zero, so a bar whose source is zero or negative is left blank rather than plotted. Nothing is averaged or smoothed, so the line has no warmup and answers from the first bar.
How to read Logarithmic Transformation (LOG)
Read the slope of the line as the rate of growth. A straight rising stretch means price is compounding at a steady percentage rate, a steepening curve means growth is speeding up, and a flattening curve means it is slowing. The difference between two values on the line is the log return between those bars, which is close to the percentage change for small moves.
The transformation changes the scale, not the shape of individual bars, so it adds no new information about turning points. It is most useful over long histories, where large price ranges would otherwise squash the early part of the chart.
Settings
- Source
- The series to transform, for example the close. Values at or below zero have no logarithm and leave a gap.
Frequently asked questions
Why are some bars blank?
The natural logarithm is defined only for values above zero. A source of zero or below has no logarithm, so that bar is left empty.
How do I read a change on the line?
A difference of 0.01 between two bars is a log return of 1 percent, which is about a 1 percent price change. Larger differences are continuously compounded returns, so 0.1 is about 10.5 percent.
Is this the same as a log price axis?
It shows the same picture, but as a plotted series in its own pane, so its values can be read directly and compared with other studies.