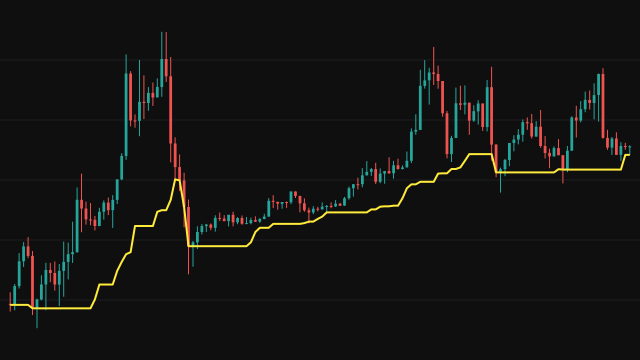
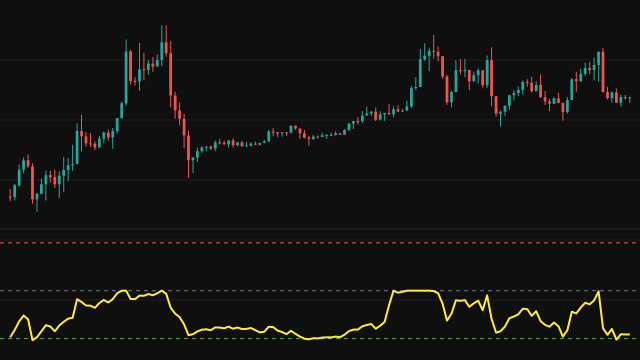
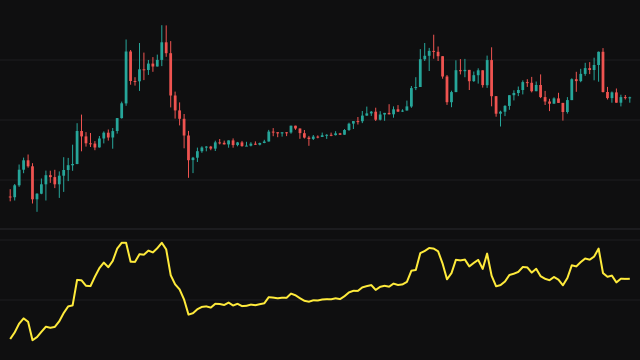
This study applies the natural logarithm to the chosen source on every bar. Prices grow multiplicatively: a stock that doubles from 50 to 100 and then from 100 to 200 has made the same move twice. On a log scale those two moves are the same height, so the chart shows proportional change rather than absolute change.
The calculation is ln(source) and nothing else. There is no window and no smoothing, so the line answers from the first bar. Zero and negative values have no logarithm, and any bar whose source falls there is left as a gap instead of being plotted.
How to read Logarithmic Transformation (LOG)
Use the line to judge growth in percentage terms. A straight rising line is steady compound growth, a curve bending upward is accelerating growth, and a curve bending flat is slowing growth. The vertical gap between any two points is the log return over that stretch, which is easy to compare across different price levels.
The study does not smooth or signal anything by itself. It is a change of scale, most helpful on long histories or on instruments whose price has moved through several multiples, where a plain price pane hides the early moves.
Settings
- Source
- The series to transform. Any bar whose value is zero or negative is left blank because it has no logarithm.
Frequently asked questions
Does the line need a warmup?
No. Each bar is transformed on its own, so the first bar already has a value.
What does a difference of 0.05 on the line mean?
It is a log return of 0.05, which is a price change of about 5.1 percent. For small moves the log return and the percentage change are almost the same.
Why would I use this instead of the price itself?
Equal percentage moves look equal on the log line, so a trend that compounds steadily shows as a straight line and moves at different price levels can be compared fairly.