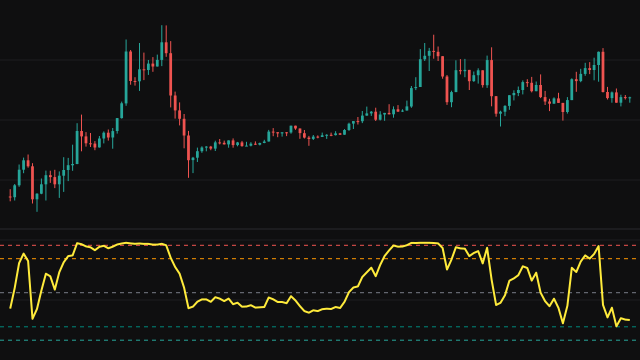
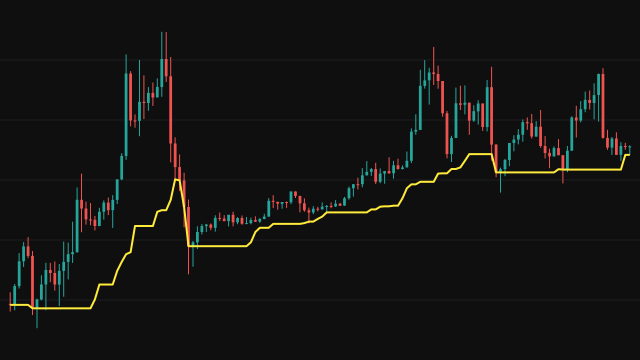
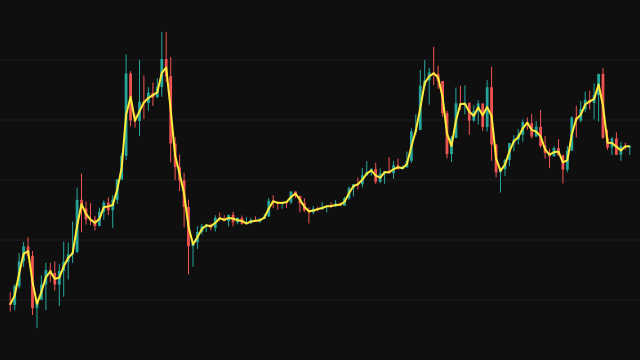
Min-Max Normalization (NORMALIZE) shows where the current value of the source sits inside its recent range. On each bar it finds the lowest and the highest values of the source over the last length bars, this bar included, and computes (source - lowest) / (highest - lowest). The result is 0 when the source is at the bottom of the window, 1 when it is at the top, and in between otherwise.
The search starts from the current bar and takes in every present value before it, so on a chart shorter than the window the range is measured against the bars that exist so far. When every value in the window is the same, the range is zero and the study reads 0.
How to read Min-Max Normalization (NORMALIZE)
Readings near 1 mean the source is at or close to the top of its recent range, and readings near 0 mean it is at or close to the bottom. A move from the low end to the high end shows price travelling across its whole recent range. Because the scale is always 0 to 1, the line can be compared across instruments with very different prices.
A reading of 1 is not a sell signal by itself: in a strong trend the source can sit at the top of its window for many bars, because each new high also raises the window's top. A longer length makes the scale steadier and slower to reach its extremes.
Settings
- Source
- The series to normalise, such as the close or the bar midpoint.
- Lookback Length
- How many bars, this one included, set the lowest and highest values. A longer window gives a steadier scale that reaches 0 and 1 less often.
Frequently asked questions
Why does the line stay at 1 during a rally?
Each new high becomes the top of the window, so the source sits exactly at the top and reads 1. It drops below 1 only when the source falls back from the highest value in the window.
Why is the value 0 on some bars where price did move?
If every value in the window is equal, the range is zero and the study reads 0. That happens mostly with a length of 1, where the window holds only the current bar.
How is it different from a stochastic oscillator?
The stochastic usually measures the close against the highest high and lowest low. This study measures the chosen source against its own lowest and highest values, on a 0 to 1 scale, without smoothing.