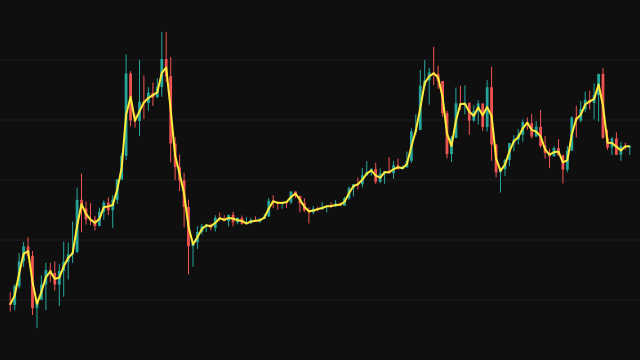
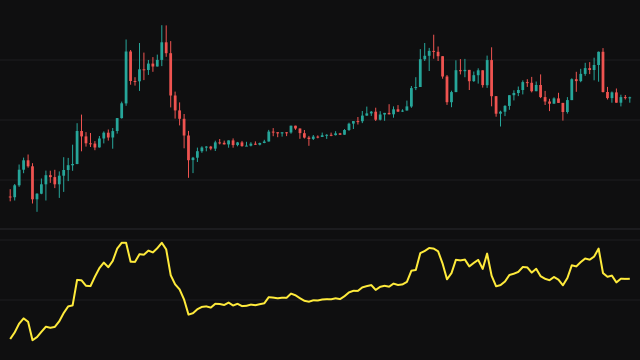
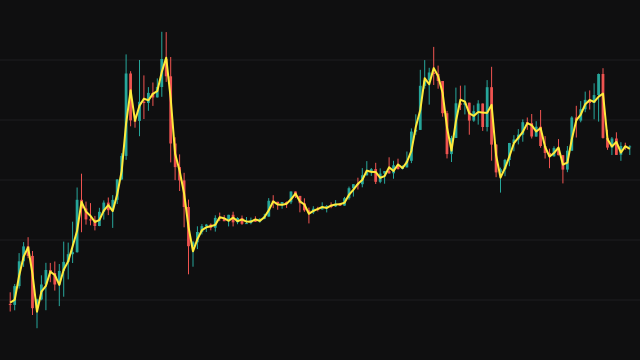
Normal Distribution CDF (NORMDIST) asks how unusual the current value is compared with its own recent history. On each bar it takes the last period values of the source, computes their mean and their standard deviation (the population form, the mean of the squares minus the square of the mean), and expresses the current value as a z-score: how many standard deviations it sits from the mean.
The z-score is then shifted by Mu and divided by Sigma, and passed through the cumulative distribution function of the normal distribution. The study evaluates that function with a three-term approximation of the error function whose error is below 1.5e-7. The output runs from 0 to 1: 0.5 means the value is at its recent mean, 0.84 is about one standard deviation above it, and 0.975 about two. Until two values are available the reading is 0.5. On a window where the source has not moved at all, the z-score is taken as zero, so the reading is 0.5 at the default Mu.
How to read Normal Distribution CDF (NORMDIST)
Read the line as a percentile. Above the 0.975 line, the source is more than about two standard deviations above its recent mean, which would be rare if the values were normally distributed; below 0.025 it is just as far below. The 0.841 and 0.159 lines mark one standard deviation either side, and 0.5 is the mean.
Extreme readings show stretched prices, but price is not normally distributed, and in a trend the source can stay near 0 or 1 for a long time. The window is short-term memory: a long period makes the scale slower to adapt, a short one makes every swing look extreme.
Settings
- Source
- The series to score against its own recent mean and spread.
- Lookback Period
- How many bars set the mean and standard deviation. A shorter window adapts faster and reaches the extremes more often.
- Mu
- Subtracted from the z-score before the probability is taken. A positive value shifts the whole line down, so the source must be further above its mean to read 0.5.
- Sigma
- Divides the z-score before the probability is taken. A value above 1 squeezes the line toward 0.5; a value below 1 pushes it to the extremes sooner.
Frequently asked questions
What does a reading of 0.975 mean?
With the default Mu and Sigma, the source is about two standard deviations above its mean over the lookback window. Under a normal distribution only about 2.5 percent of readings would be that high.
Why can the line sit near 1 for a long time?
In a steady trend the latest value keeps landing far from the window's mean. The study measures position, not exhaustion, so it can stay extreme while the trend lasts.
Why is the first bar 0.5?
A spread needs at least two values. Until the window holds two, the study reports the centre of the scale.