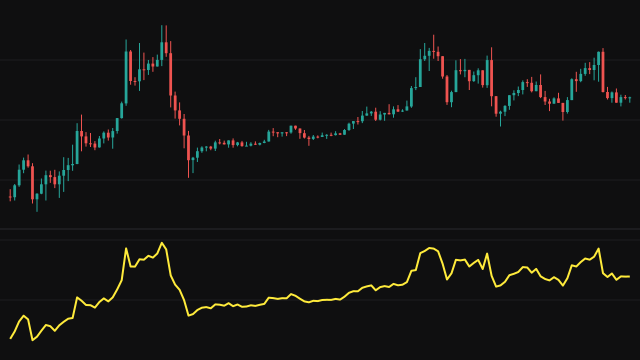
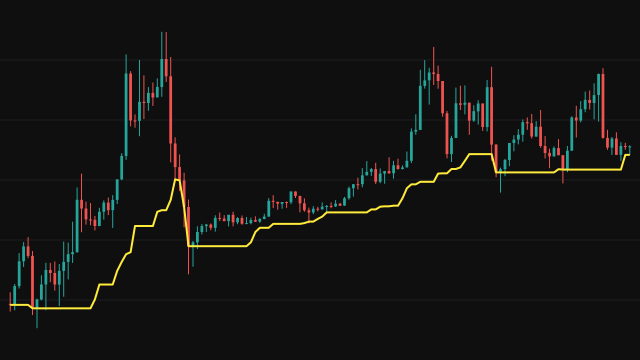
This study first normalises the source to its recent range: over the lookback window it finds the lowest and highest values and expresses the current value as a position from 0 at the low to 1 at the high. A flat window, with no range, puts the position at 0.5, and the position is floored at 1e-10 so its logarithm always exists.
The position is then read off the cumulative distribution of a log-normal distribution: the study takes (ln(position) - mu) / sigma and passes it through the standard normal CDF, computed with the five-term polynomial approximation 26.2.17 of Abramowitz and Stegun, whose error is below 7.5e-8. While fewer than period bars exist, the range is taken over every bar so far, so the line answers from the first bar.
How to read Log-Normal Distribution CDF (LOGNORMDIST)
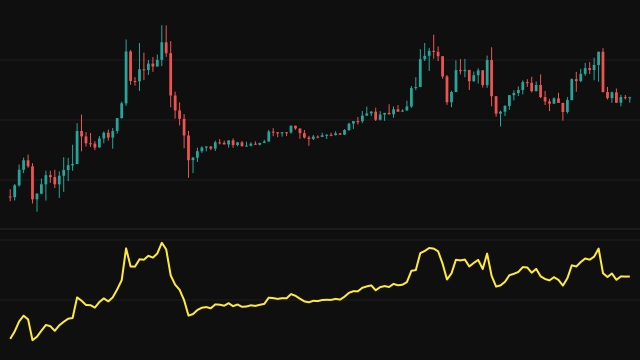
Readings near 1 mean price is at the top of its recent range and readings near 0 mean it is at the bottom, but the scale is bent by the log-normal curve. With the default mu of 0 and sigma of 1, the top of the range reads 0.5, the middle about 0.24, and the bottom close to 0, so most of the oscillator's movement happens in the lower half of the pane.
Lower sigma to make the S-curve steeper, so small changes in position move the line more. Negative values of mu move the curve left, letting the top of the range read above 0.5 and reach the 0.95 reference line. The lines at 0.05, 0.5 and 0.95 mark the tails and the middle of the distribution.
Settings
- Source
- The series whose position inside its own high-low range is measured.
- Lookback Period
- How many bars set the high and low used to normalise the source. A longer window gives a wider range and a slower oscillator.
- Mu
- The location of the curve, the mean of ln of the position. Lower values shift the curve left so a given position reads higher.
- Sigma
- The spread of the curve, the standard deviation of ln of the position. Lower values make the S-curve steeper.
Frequently asked questions
Why does the line top out at 0.5 with the default settings?
At the top of the range the position is 1 and ln(1) is 0, which equals the default mu, so the CDF reads exactly 0.5. Set mu below zero to let the top of the range read higher.
Why is the position floored at 1e-10?
At the bottom of the range the position is 0, and the logarithm of 0 does not exist. The floor keeps the value finite, so the line reads very close to 0 there instead of leaving a gap.
Does the line need a warmup?
No. Until period bars exist, the range is taken over every bar seen so far, so the line has a value from the first bar.