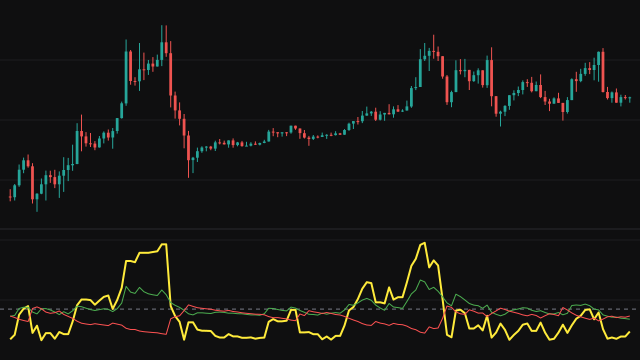
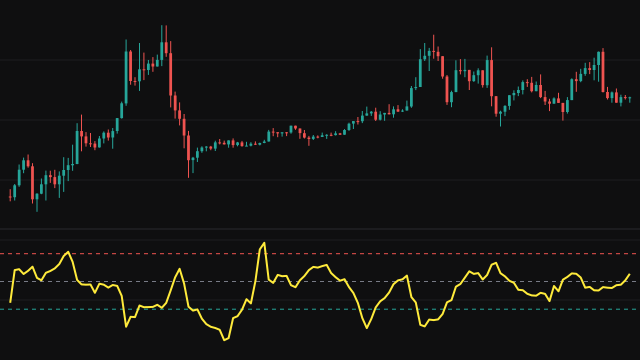
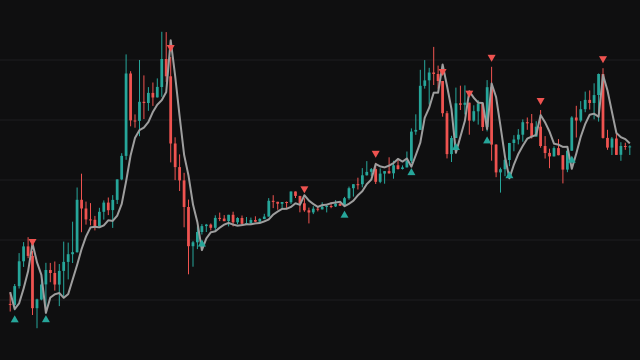
DMX starts from the directional movement of each bar. Upward movement is the rise in the high from the previous bar, counted only when it is positive and larger than the fall in the low; downward movement is the fall in the low, counted under the mirror condition. Each is smoothed with a Wilder average that starts from zero and is scaled up by the factor that zero start leaves out, giving a plus and a minus directional value.
The raw reading is their difference divided by their sum, so it runs from -1 when all movement is downward to +1 when all of it is upward, and it is zero when there is no movement at all.
That raw reading is then passed through an adaptive average instead of the usual second Wilder smoothing. The average tracks its own volatility over the last ten bars and against a longer running mean of it, and speeds up when the input jumps and slows down when it is quiet, which keeps the line smooth with less delay than a fixed average of similar smoothness.
How to read Jurik Directional Movement Index (DMX)
Above zero, upward directional movement has dominated; below zero, downward. The further from zero, the more one-sided the movement. A cross of zero marks the point where the balance of directional movement changes side, and it tends to come earlier and with fewer false crossings than a line smoothed the usual way.
The line measures direction, not strength of trend in the usual sense: a slow, steady climb and a sharp rally can read alike. The first bars are shaped by the zero-started averages and settle after a few periods.
Settings
- Period
- The length of the directional movement smoothing, which also sets the constants of the adaptive average. A longer period gives a slower, smoother line.
Frequently asked questions
Why does the line stay between -1 and +1?
The raw value is the difference of the two directional values divided by their sum, which can never exceed one in size. The adaptive average stays close to that range.
How is it different from the usual directional index?
The usual index smooths the directional difference with another Wilder average and drops the sign. This one keeps the sign and uses an adaptive average that reacts faster with less whipsaw.
What does a reading of zero mean?
Upward and downward movement have been in balance over the smoothing window, or there has been no directional movement at all.