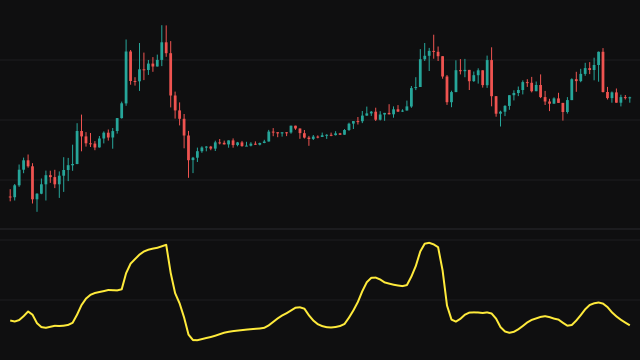
The Choppiness Index compares how much ground price covered bar by bar with how far it actually travelled. Over a window of length bars it adds up the true range of every bar (each bar's range, stretched to include any gap from the previous close) and divides that total by the window's full range, its highest high minus its lowest low.
The ratio is taken as a base ten logarithm and divided by the logarithm of the number of bars in the window, then multiplied by 100 and held between 0 and 100. When the bars all push the same way, their ranges add up to little more than the window's range and the reading is low. When the bars overlap and go back and forth, their ranges add up to far more than the window's range and the reading is high.
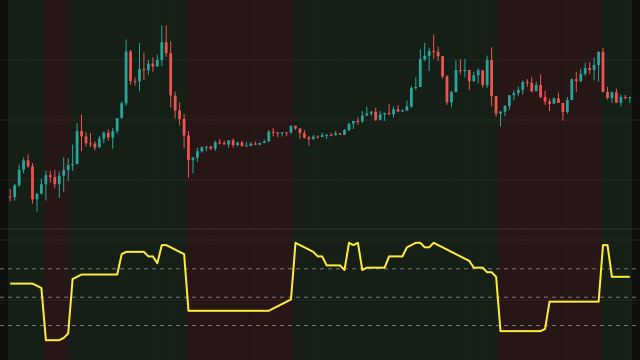
While fewer than length bars exist, the window is every bar so far, so the line starts on the second bar. Dashed reference lines sit at 61.8, 50 and 38.2.
How to read Choppiness Index
High readings, above about 61.8, describe a choppy, sideways market where bars overlap a lot; low readings, below about 38.2, describe a market moving steadily in one direction. The index says nothing about which direction, only how directional the movement has been.
Traders often use it as a filter: favour trend-following methods while the index is low or falling, and range methods while it is high. A long stay at high values says only that price has been going back and forth; it does not tell you when that will end or in which direction. The early bars use a shorter window and are less reliable.
Settings
- Length
- The number of bars in the window. A longer window gives a smoother reading that changes regime less often.
Frequently asked questions
Does a low Choppiness Index mean the market is rising?
No. It means the market has been moving in one direction, which could be up or down. Use price or another study to tell which.
Where do the 61.8 and 38.2 lines come from?
They are customary thresholds for a choppy and a trending market. They are guides drawn on the pane, not part of the calculation.
Why does the line start on the second bar?
With only one bar the window has no meaningful length to normalise by. From the second bar the window is every bar so far, until it reaches the full length.