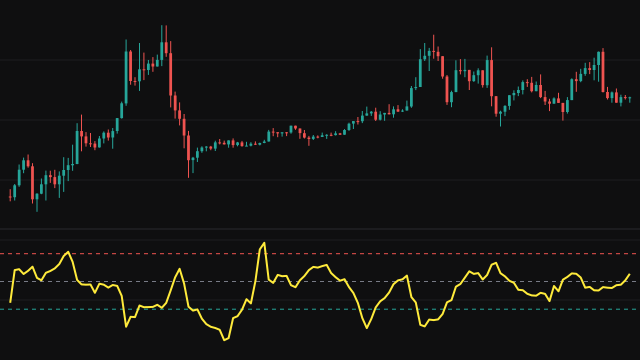
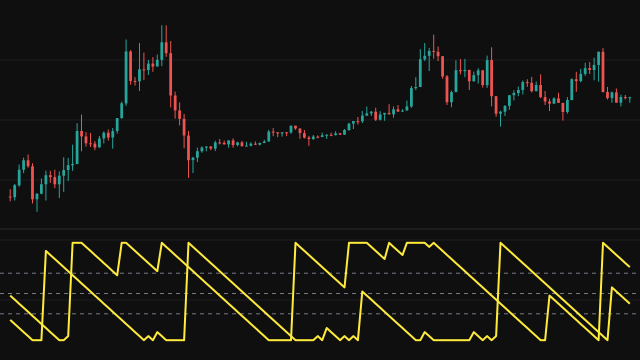
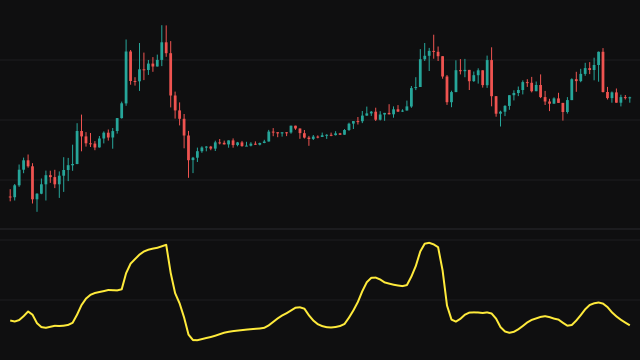
The Aroon Oscillator folds the two Aroon lines into one. Over a window of period bars it finds how many bars ago the highest high and the lowest low were set. Aroon Up is 100 * (period - bars since the high) / period and Aroon Down is the same for the low, so each reads 100 on the bar that sets a new extreme and falls toward 0 as that extreme ages.
The oscillator is Aroon Up minus Aroon Down. Its highest possible reading is 100 * (period - 1) / period, just under +100, when the window's high was set on this bar and its low on the oldest bar of the window; its lowest is the mirror image, just above -100. Zero means the high and the low are the same age.
The pane background is shaded faint green while the oscillator is above zero and faint red while it is at or below zero; the warmup bars before the window fills are left unshaded. Reference lines sit at 0, +50 and -50, and four alerts are declared: crossing above zero, crossing below zero, above +70 and below -70.
How to read Aroon Oscillator
A reading above zero says the most recent new high is fresher than the most recent new low, which is how an uptrend looks; below zero says the reverse. Readings beyond +50 or -50 show one side clearly in control, and the alert levels at +70 and -70 mark a strong, one-sided move.
A crossing of zero is the point where the fresher extreme switches sides, and the background colour flips with it. In a sideways market the oscillator swings back and forth through zero often, so treat a single crossing with caution. It measures how recently extremes were set, not how far price moved.
Settings
- Period
- The number of bars in the look-back window. A longer window makes the oscillator smoother and slower to cross zero.
Frequently asked questions
Why does the oscillator move in straight steps?
Between new extremes each Aroon line changes by exactly 100 divided by the period per bar, so their difference moves in fixed steps until a new high or low resets one of them.
What does the background colour show?
Green while the oscillator is above zero and red while it is at or below zero. It only starts once the window has filled and the oscillator has a value.
Which alerts does it provide?
A crossing above zero, a crossing below zero, a reading above +70 for a strong uptrend and a reading below -70 for a strong downtrend.