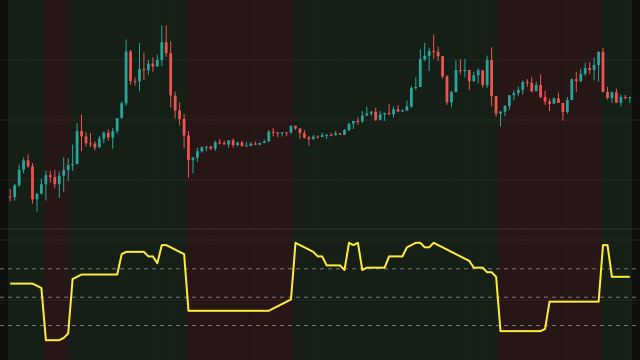
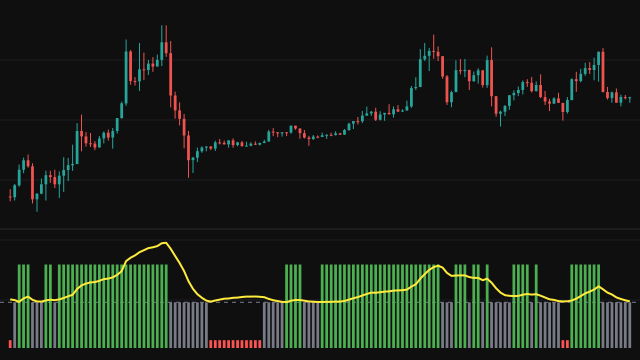
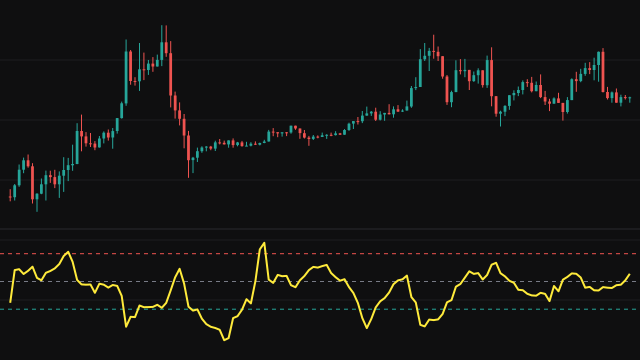
Aroon measures time rather than price. Over a window of period bars it finds the bar that set the highest high and the bar that set the lowest low, and counts how many bars ago each one was.
Aroon Up is 100 * (period - bars since the high) / period, so it reads 100 on the bar that makes a new high for the window and falls steadily toward 0 as that high ages. Aroon Down is the same calculation for the lowest low. Both lines appear once the window has filled.
The study draws reference levels at 70, 50 and 30, and declares four alerts: Aroon Up crossing above Aroon Down, Aroon Down crossing above Aroon Up, a strong uptrend (Up above 70 while Down is below 30) and a strong downtrend (the reverse).
How to read Aroon (AROON)
When Aroon Up stays near 100 and Aroon Down stays low, the market keeps printing new highs and has not made a new low for a while: an uptrend. The reverse picture is a downtrend. When both lines sit low together, neither extreme has been renewed recently and price is drifting in a range.
A crossing of the two lines shows that the more recent extreme has switched sides, an early hint that control is changing. Aroon only knows when the extremes happened, not by how much price moved, so a fresh high by a single tick counts the same as a large breakout.
Settings
- Period
- The number of bars in the look-back window. A longer window changes the lines more slowly and needs a more lasting move to reach 100.
Frequently asked questions
Why does Aroon Up drop in a straight line?
Between new highs, the bars-since count rises by one each bar, so Aroon Up falls by 100 divided by the period on every bar. It jumps back up when a new high resets it to 100, or when the old high leaves the window and a more recent high takes its place.
What does it mean when both lines are below 50?
Neither the high nor the low of the window has been set in the more recent half of it. Price is moving sideways inside an older range.
Which alerts does it provide?
Aroon Up crossing above Aroon Down, Aroon Down crossing above Aroon Up, a strong uptrend with Up above 70 and Down below 30, and a strong downtrend with Down above 70 and Up below 30.