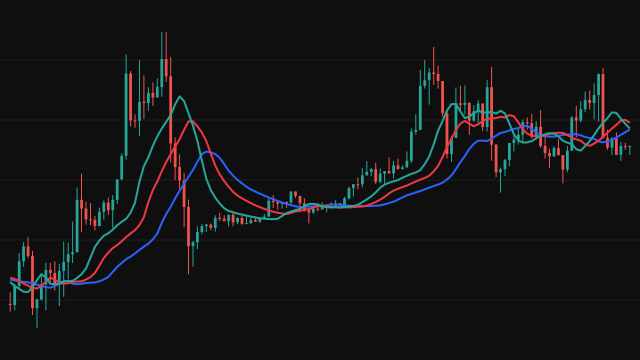
AMAT asks two exponential moving averages, a fast one and a slow one, whether they agree. Both start from the first value of the source and follow the usual exponential recursion with a weight of 2 / (period + 1).
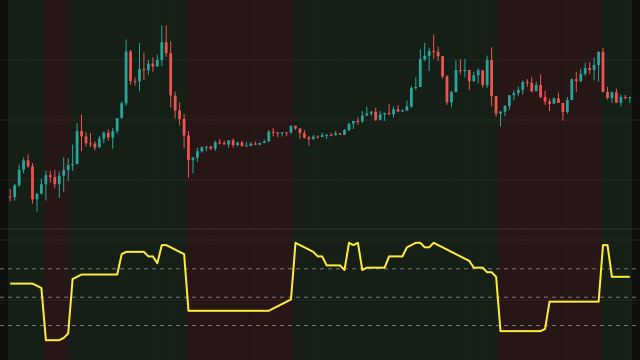
A bar is an uptrend bar, drawn as a column of +1, when the fast average is above the slow one and both averages rose on this bar. It is a downtrend bar, a column of -1, when the fast average is below the slow one and both fell. Every other bar is 0: the averages are in one order but at least one of them is moving the other way, so the trend is not confirmed.
The second line, Trend Strength %, is the distance between the two averages as a percentage of the slow average. It grows as the averages pull apart and shrinks as they converge, whichever side is on top.
How to read Archer Moving Averages Trends (AMAT)
Green columns at +1 mark bars where the uptrend is confirmed by both order and slope, red columns at -1 mark confirmed downtrend bars, and a flat zero means the averages disagree. A long unbroken run of one colour is a clean trend; a mix of zeros and short runs is a market without direction.
Use the strength line to judge how established a trend is. A rising strength line with steady columns shows the averages separating, while a falling one warns that they are converging and a crossing may follow. Both readings come from moving averages, so they confirm a move after it starts rather than predicting it.
Settings
- Fast Period
- Length of the fast exponential average. A shorter length reacts sooner and breaks the trend state more often.
- Slow Period
- Length of the slow exponential average. A longer length makes the trend state steadier and the strength readings larger.
- Source
- The price series both averages follow, the close by default.
Frequently asked questions
Why is the value zero when the fast average is clearly above the slow one?
A trend bar also needs both averages to be moving in the trend's direction on that bar. If either one ticked the other way, the bar is reported as 0 until they agree again.
Does the strength line show direction?
No. It is the absolute spread as a percentage of the slow average, so it never drops below zero while the slow average is above zero. Read the direction from the columns.
Why does the first bar show no trend?
Both averages and their previous values start at the first source value, so on that bar they are equal and neither the order nor the slope test can pass.