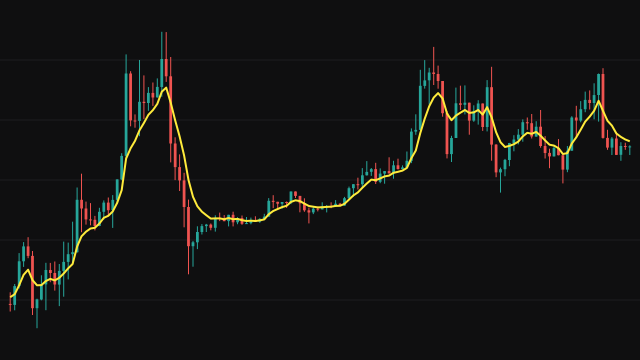
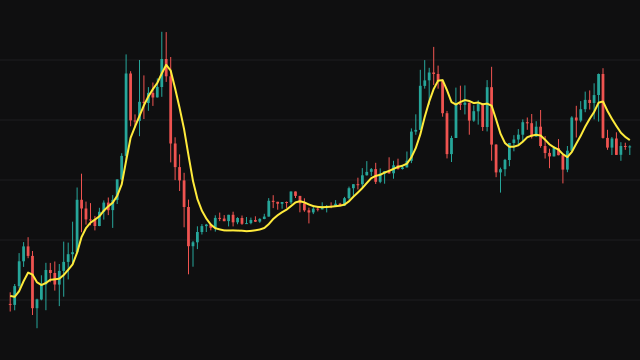
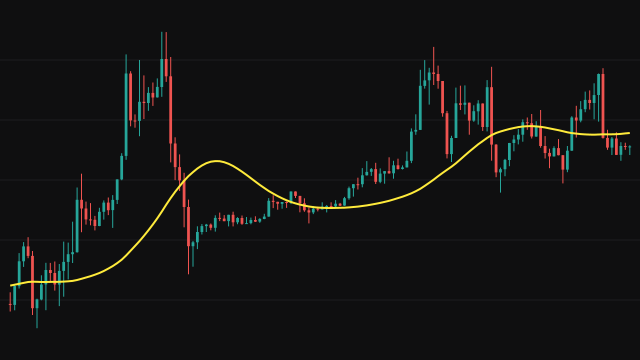
This study treats price as a noisy reading of a hidden level and keeps a running estimate of that level. Each bar it predicts that the level has not moved, adds the process noise Q to the uncertainty of that prediction, and then corrects the estimate toward the new price by a gain.
The gain is p / (p + R), where p is the uncertainty after the prediction and R is the measurement noise. A large gain means the new price is trusted and the line moves most of the way to it; a small gain means the price is treated as noise and the line barely moves. After the correction the uncertainty shrinks by the share the gain used. The estimate starts at the first price with an uncertainty of 1, and a missing price reading counts as zero.
After a few bars the uncertainty settles to a steady value set only by Q and R, so the filter behaves like a smoothing average whose speed you set through those two numbers.
How to read Kalman Filter (KALMAN)
Read the line as the filtered price level. When price stays above it and it slopes up, the hidden level is rising; when price stays below it and it slopes down, the level is falling. The distance between price and the line shows how much of the latest move the filter has dismissed as noise.
Raise Q or lower R and the line follows price closely with little lag but more wiggle. Lower Q or raise R and it becomes smoother and slower. The filter assumes a level that does not trend, so in a strong steady move it will lag behind price.
Settings
- Source
- The price series that is filtered, the close by default.
- Process Noise (Q)
- How much the hidden level is assumed to move by itself each bar. Larger values make the line track price more closely.
- Measurement Noise (R)
- How noisy each price reading is assumed to be. Larger values trust each bar less and smooth the line more.
Frequently asked questions
What matters more, Q or R?
Their balance. Raising Q relative to R speeds the line up; raising R relative to Q slows it down. Moving both together in the same direction changes the line much less.
Why does the line start exactly on the first price?
The estimate is seeded with the first price and an uncertainty of 1, then corrected on every later bar.
Is this a prediction of the next bar?
No. It is an estimate of the current underlying level using the bars so far. The prediction step inside the filter only assumes the level stays where it was.