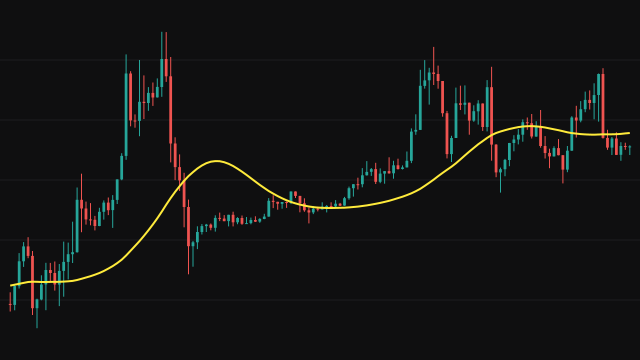
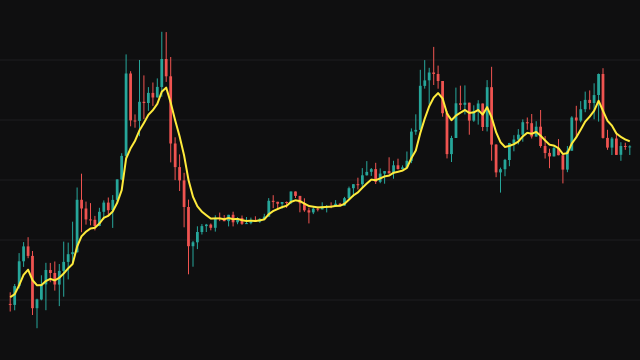
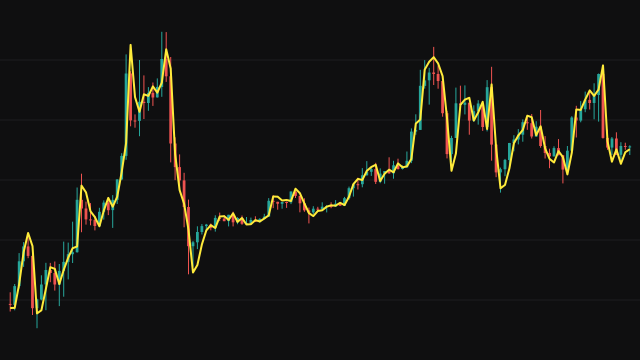
This study keeps an estimate of a hidden price level and its uncertainty, and updates both on every bar. First it predicts: the level is assumed unchanged, and the uncertainty grows by the process noise Q. Then it corrects: the estimate moves toward the new price by a gain of p / (p + R), where p is the predicted uncertainty and R the measurement noise, and the uncertainty shrinks by the same share.
The estimate is seeded on the first bar with that bar's price and an uncertainty of 1, and seeded again if it ever goes missing. A missing price reading counts as zero.
After the first few bars the uncertainty reaches a steady value fixed by Q and R, and from then on the line moves a constant share of the way toward each new price. In that state it behaves like an exponential average whose speed comes from the two noise settings rather than from a bar count.
How to read Kalman Filter (KF)
Treat the line as the price level once noise is filtered out. Its slope shows the direction of that level, and the gap between price and the line shows how much of the newest move the filter has not yet believed. Price holding on one side of the line for several bars is a sign that the level itself is moving.
A larger Q follows price more closely, and a larger R smooths it more. Because the model assumes a level with no built-in trend, the line lags a strong steady move and catches up once the move slows.
Settings
- Source
- The price series treated as the noisy measurement, the close by default.
- Process Noise (Q)
- How much the hidden level is assumed to move on its own each bar. Larger values track price more closely.
- Measurement Noise (R)
- How noisy each price reading is assumed to be. Larger values smooth the output more.
Frequently asked questions
How do I make the line smoother?
Lower Q or raise R. Either change tells the filter to trust each new bar less, so it moves a smaller share of the way toward each price.
Why does it behave like an exponential average after a while?
The uncertainty settles to a fixed value set by Q and R, so the gain becomes constant. A constant gain applied to each new price is exactly an exponential average.
Does the line change once a bar has closed?
No. Each value depends only on the current and earlier bars.