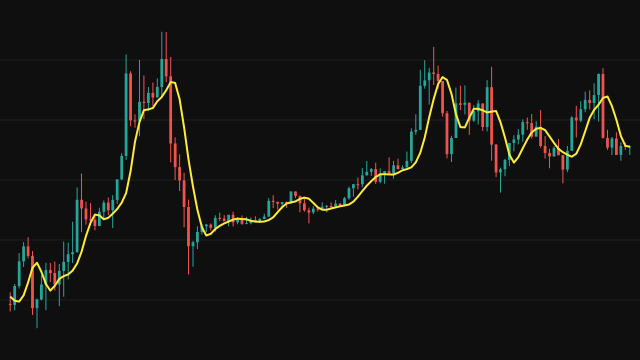
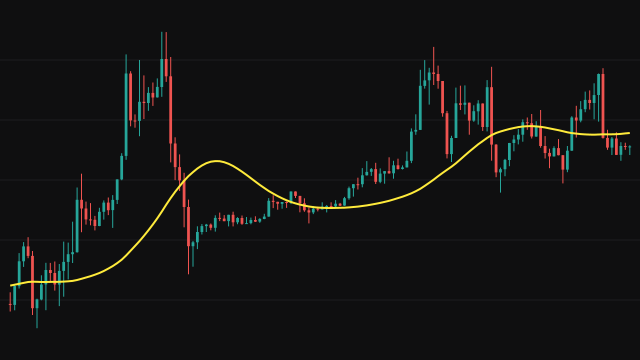
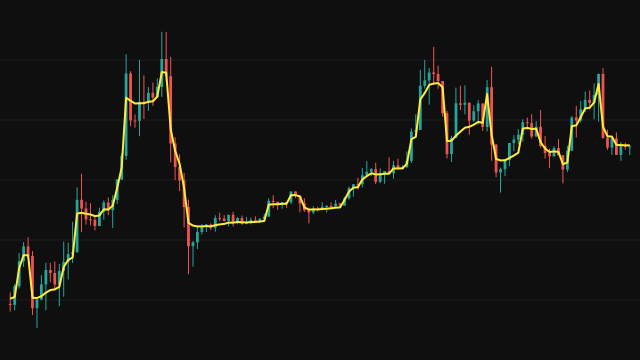
This study is a filter that learns. It holds one weight for each of the previous Filter Order bars, and on every bar it predicts the current price as the weighted sum of those earlier prices. The line on the chart is that prediction, made before the current bar is seen.
Once the bar is known, the error between price and the prediction is used to adjust every weight. Each weight moves by mu / (tiny + sum of squared inputs) * error * input, a normalised least mean squares step: dividing by the energy of the inputs keeps the speed of learning the same whatever the price level. The weights start at zero and are kept for the whole run, so the filter keeps refining itself as more bars arrive.
History before the first bar reads as zero, so the first Filter Order predictions rest on padded inputs. They still train the weights, but they are not drawn.
How to read Least Mean Squares Adaptive Filter (LMS)
Read the line as the filter's best estimate of price built only from the bars before it. While the market behaves the way it has recently, the line sits close to price; when price breaks away sharply, the gap widens until the weights adapt. A persistent gap in one direction shows a move the recent pattern did not anticipate.
A higher learning rate makes the weights react faster, so the line follows price more tightly but with more noise. More taps let the filter use a longer stretch of history and adapt more slowly. The prediction is not a forecast of the next bar on the chart; it is an estimate of the current bar from the ones before it.
Settings
- Filter Order (taps)
- How many previous bars the filter weighs. More taps capture longer structure but adapt more slowly, and the line starts later.
- Learning Rate (mu)
- The size of each weight update. Higher values follow price faster with more noise; lower values give a calmer, slower line.
- Source
- The price series the filter predicts and learns from, the close by default.
Frequently asked questions
Why does the line start a few bars into the chart?
The first predictions use history padded with zeros, because the earlier bars do not exist. Those bars still train the weights, but the line is only drawn once a full set of real bars is available.
Why is the step normalised?
Without normalisation a high-priced instrument would make the weights jump far more than a low-priced one. Dividing by the sum of squared inputs makes the learning rate mean the same thing on any price level.
Does the filter forget old behaviour?
Gradually. Every new error pulls the weights toward the latest pattern, so recent bars dominate, but there is no explicit forgetting factor.