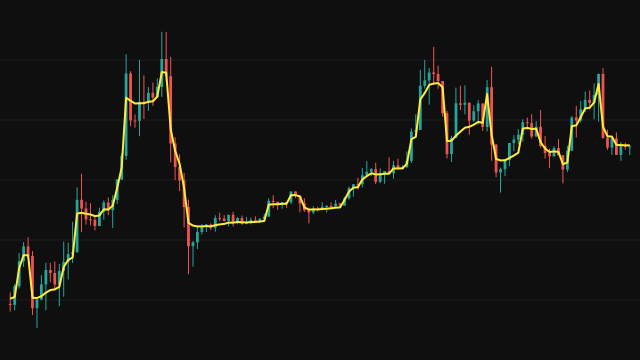
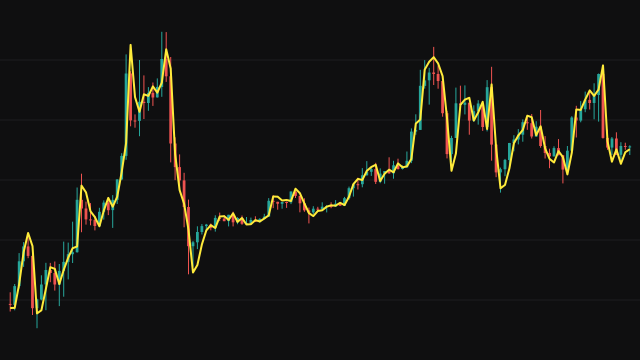
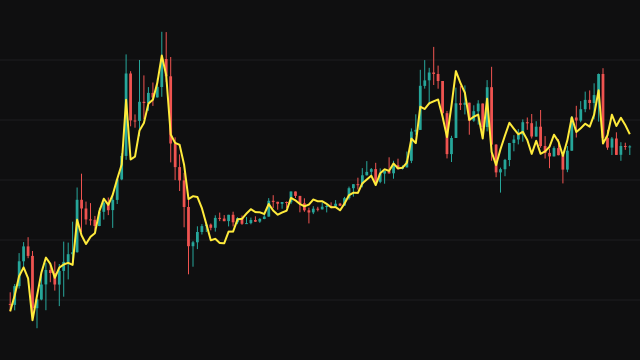
This study smooths price with local regression. On each bar it takes a window of recent values, fits a straight line through them by weighted least squares, and draws one point of that line. The window size is the Length setting, rounded down to an odd number so the window has a centre.
Tap i of the window is the value i bars back, placed at the position x = i - half, where half is half the window rounded down. Each tap is weighted with the tricube kernel (1 - |x / half|^3)^3, which is largest at the centre of the window and falls to exactly zero at both ends. The fitted line is then read at x = 0, the centre bar of the window, which is half bars back. Because the weights are the same on both sides of the centre, once the window is full the fitted slope adds nothing at that point, and the value drawn equals the tricube-weighted average of the window: with the default Length of 7, the centre bar weighs 1, its neighbours about 0.89, the next pair about 0.35 and the two ends 0.
On the first bars, taps before the start of the chart are skipped, so the window is lopsided and the slope does shift the result. When no tap carries weight the bar keeps its own price, and when the remaining taps cannot define a line the bar has no value.
How to read LOESS Filter
Read the line as a smoothed price centred on a bar in the middle of the window. The value drawn on the newest bar describes price about half a window ago, so the line lags price by roughly half the Length, much like a simple average of the same length, but its bell-shaped weights give a smoother curve with fewer steps when bars enter and leave the window. A rising line shows that the weighted centre of the recent window is moving up; a flattening line shows the window turning.
A longer window gives a smoother, slower line. The newest bar and the oldest bar of the window carry zero weight, so a sharp move on the latest bar does not show at all until the next bar, and takes several bars to show fully.
Settings
- Length
- The number of bars in the fitting window, rounded down to an odd number. Larger windows smooth more and react later.
- Source
- The price series that is smoothed, the close by default.
Frequently asked questions
Why is the window always odd?
An odd window has a single centre bar, which is where the fitted line is read. An even length is reduced by one to get there.
Why do the outermost bars not count?
The tricube weight is zero at the edge of the window, so the oldest and newest taps contribute nothing. This makes the fit change smoothly as bars enter and leave the window.
How is this different from a moving average?
Once the window is full it is a centred weighted moving average: the symmetric tricube weights cancel the slope of the fit at the centre, so the result is the weighted mean of the window. Compared with a simple average of the same length it lags about as much but weights the centre most and the ends not at all, which gives a smoother line.