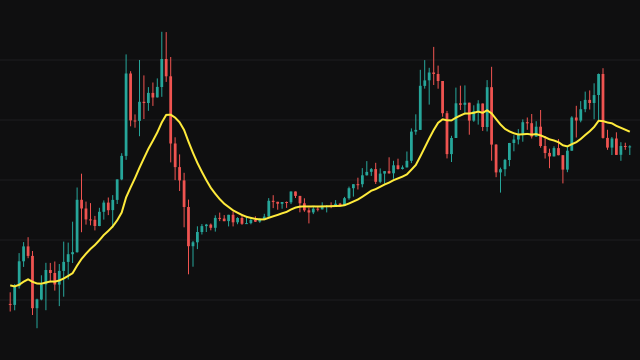
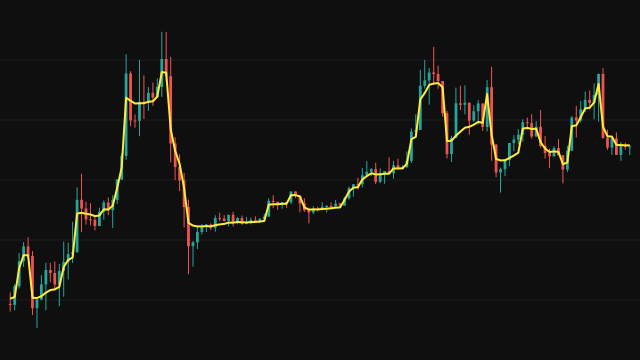
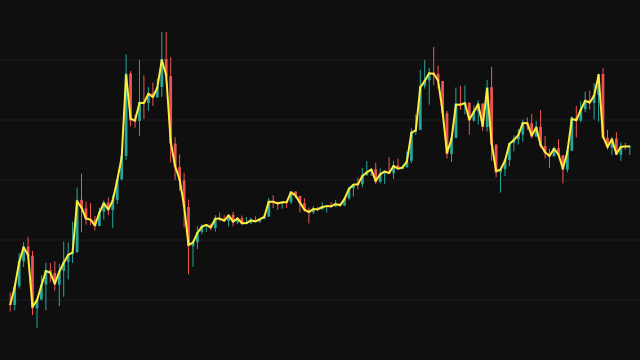
This study takes one cycle out of price. It is a second-order recursive notch filter centred on the Period to Remove: a swing of exactly that length is cancelled, swings close to it are reduced, and slower and faster movement passes through almost unchanged.
The centre angle is 2 * pi / Period. The width of the notch is the Relative Bandwidth times that angle, and half of it, held between 0.0001 and just under a quarter turn, sets a pole factor (1 - tan) / (1 + tan). From the pole factor and the cosine of the centre angle come the filter coefficients, and each bar's output combines the current price, the two previous prices and the two previous outputs.
On the first bar the delay line is filled with the first price, so the filter starts at rest instead of jumping from zero. A missing price reading counts as zero.
How to read Notch Filter (NOTCH)
Use the line as price with one rhythm taken out. If a market keeps repeating a swing of a known length, for example a session cycle on intraday bars, setting the period to that length removes it and makes the underlying move easier to see. The line stays close to price otherwise, so it adds very little lag compared with a smoothing average.
A wider bandwidth removes cycles over a broader range around the period, at the cost of a little more distortion nearby. If the period you choose does not match a real cycle in the data, the filter simply has little effect.
Settings
- Source
- The price series that is filtered, the close by default.
- Period to Remove
- The cycle length, in bars, at the centre of the notch. A swing of exactly this length is cancelled.
- Relative Bandwidth
- The width of the notch as a fraction of its centre frequency. Larger values remove a broader range of cycles around the period.
Frequently asked questions
How is a notch filter different from a moving average?
A moving average removes all fast movement and lags. A notch removes only a narrow range of cycle lengths and leaves the rest, so the line stays close to price.
How do I choose the period?
Pick a cycle you can see repeating in the data, such as the number of bars in a trading session. If you are unsure, compare a few periods and keep the one that removes the most regular wiggle.
Why does the line start on the first price?
The delay line is filled with the first price on the first bar, so the filter begins at rest rather than climbing up from zero.