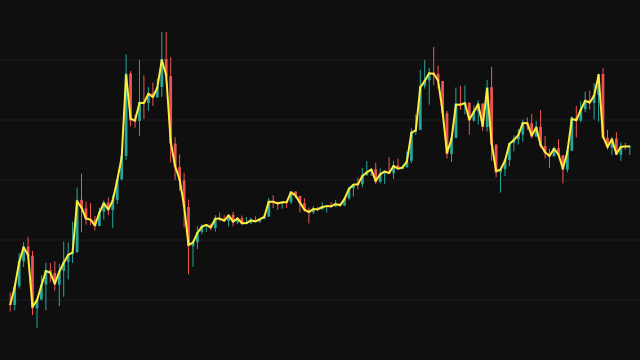
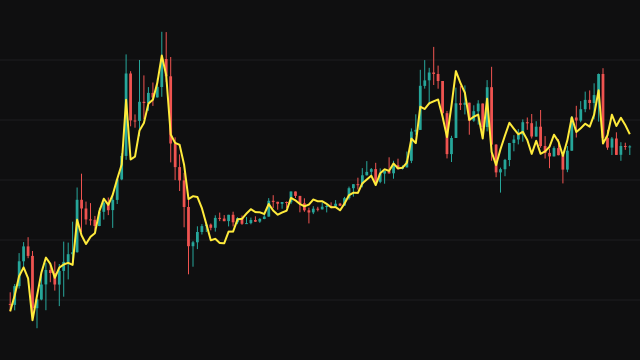
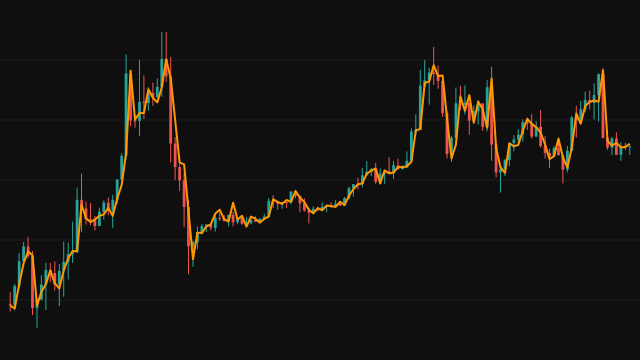
This study smooths price with a kernel regression that looks only backward. On each bar it averages the last Period values, giving the value i bars back the Gaussian weight exp(-i^2 / (2 * h^2)), where h is the Bandwidth. The current bar has weight 1, and the weight of older bars falls away smoothly, quickly for a small bandwidth and slowly for a large one.
The result is the weighted sum of the prices divided by the sum of the weights. At the start of the chart the window simply holds every bar so far, so the line begins on the first bar and widens to its full length as bars arrive. A missing price counts as zero while still carrying its weight.
Because it uses only the current and earlier bars, the line never changes once a bar has closed.
How to read NW - Nadaraya-Watson Kernel Regression
Read the line as a smoothed price. Its slope shows the direction of the recent average and the distance from price shows how far price has moved away from that average. Price crossing the line marks the latest move overtaking the weighted recent past.
The bandwidth does most of the work: a small bandwidth concentrates the weight on the last few bars and tracks price closely, while a large one spreads it across the window and gives a slow, smooth line. The Period only needs to be long enough to hold the bars that still carry meaningful weight, roughly three bandwidths.
Settings
- Period
- How many bars the average looks back over. Bars beyond about three bandwidths carry almost no weight, so a much longer period changes little.
- Bandwidth (h)
- The width of the Gaussian kernel. Small values track price closely; large values smooth heavily.
- Source
- The price series that is averaged, the close by default.
Frequently asked questions
Does this line repaint?
No. It only weights the current and earlier bars, so each value is fixed once its bar closes. Kernel regressions that also look at later bars do repaint; this one does not.
Why does the line appear from the very first bar?
The window grows with the data: on early bars it uses every bar available, and it reaches the full Period once enough bars exist.
Which setting should I adjust first?
The bandwidth. It decides how quickly older bars lose weight, which is what sets the smoothness. Adjust the Period only if you raise the bandwidth so far that the window cuts off bars that still carry weight.