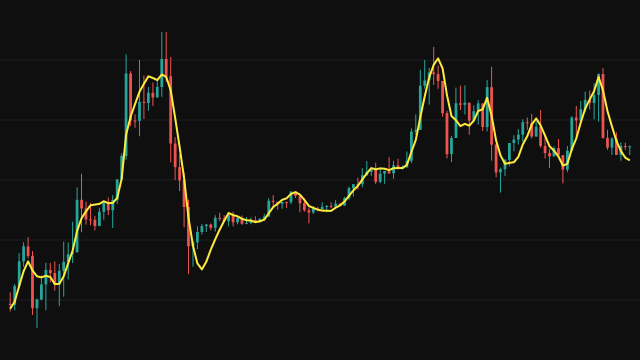
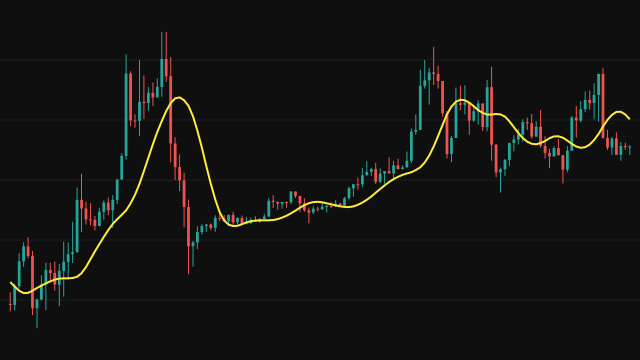
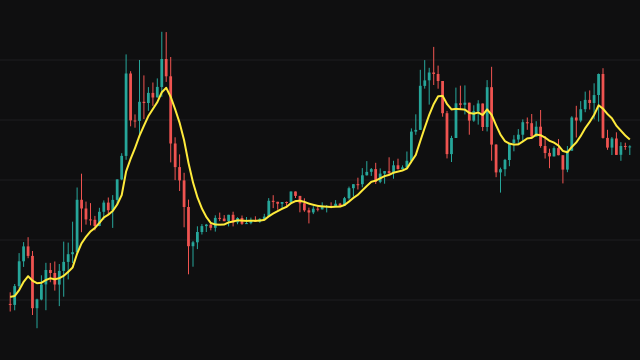
LEMA starts with an exponential average of the source using the weight 2 / (period + 1). It then measures that average's tracking error, the source minus the average, and smooths the error with a second exponential average of the same weight. The line is the first average plus the smoothed error.
Adding the error back pulls the line toward price in the direction it has been lagging, so it leans ahead of a plain exponential average without losing its smoothness.
Both averages start from zero and on the early bars are divided by 1 - beta^n, where beta is one minus the weight. That removes the pull toward zero, so the line follows price from the first bar. An absent source reads as zero.
How to read Leader EMA (LEMA)
Use LEMA as a quicker exponential average. It sits closer to price during a trend and turns earlier when the trend ends, so a cross of price through LEMA or of LEMA through a slower average comes sooner than it would with a plain one.
The lead comes from adding the smoothed error back, so after a sudden spike LEMA can briefly run ahead of price before settling. On very noisy charts use a longer period.
Settings
- Source
- The price series the average follows. Close is the usual choice; hl2 or another blend smooths out closes that jump around.
- Period
- Length of both exponential averages. A longer period gives a smoother line with a smaller lead.
Frequently asked questions
How is LEMA different from a double exponential average?
Once the early-bar correction has faded they give the same line. Smoothing the error source - EMA with an exponential average equals the EMA of the source minus the EMA of the EMA, so the sum is 2 * EMA - EMA(EMA), the double exponential formula. LEMA reaches it by smoothing the tracking error, and only the first bars differ, because each stage is corrected for its zero start separately.
Why is the line drawn from the first bar?
Both averages are scaled by 1 / (1 - beta^n) while they are young, which removes the bias of starting at zero, so no warmup gap is needed.