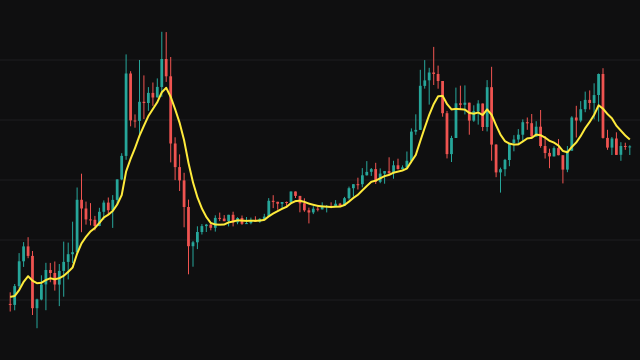
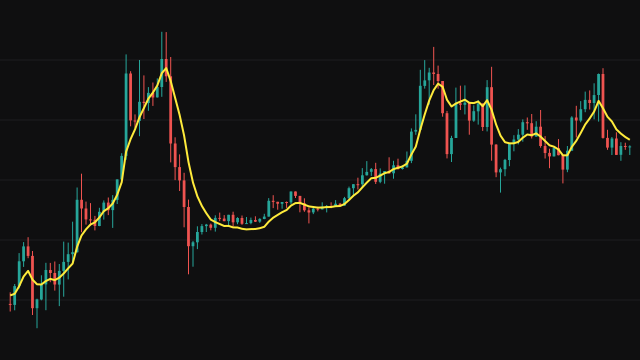
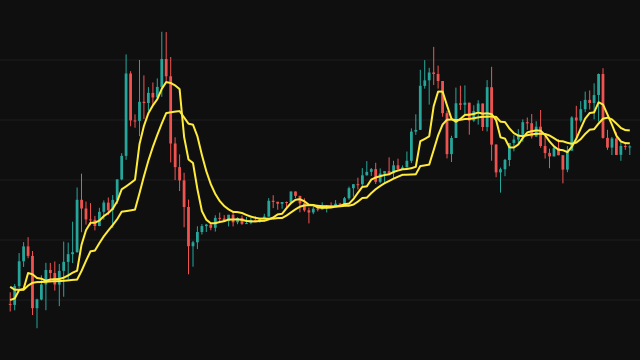
The Least Squares Moving Average fits a straight line through the last period prices by least squares, the line that minimises the sum of squared distances to the prices in the window. It then plots the value of that line on the current bar rather than the average of the window. Because the fitted line follows the trend, its endpoint sits close to the latest price and lags far less than a simple average.
The window grows with the chart until it holds period bars, and the very first bar of the chart never enters it. Wherever a line cannot yet be fitted, on the first two bars or with a period of one, the value is the source itself.
How to read Least Squares Moving Average (LSMA)
Read the LSMA as a trend line that projects the recent trend to the present bar. In a steady trend it runs right alongside price; when the trend bends, it overshoots for a few bars because the fitted line still points the old way.
A close above a rising LSMA describes a market keeping pace with its trend, and a cross of price through the line can mark a change in the short-term direction. On a short period it is noisy, since a straight line through a few bars swings with every bar.
Settings
- Period
- Number of bars the straight line is fitted to. A longer window gives a steadier line that reacts later.
- Source
- The price series the line is fitted to, the close by default.
Frequently asked questions
Why does it lag less than a simple average?
A simple average sits at the middle of its window. The LSMA reads the fitted trend line at the newest bar, which is where the trend has carried price.
Why does it overshoot at turns?
The straight line is fitted to the whole window. Right after a reversal most of the window still slopes the old way, so the endpoint keeps moving in that direction for a few bars.
What happens at the start of the chart?
The first bar never enters the window, so the line equals price until there are at least two bars after it to fit.