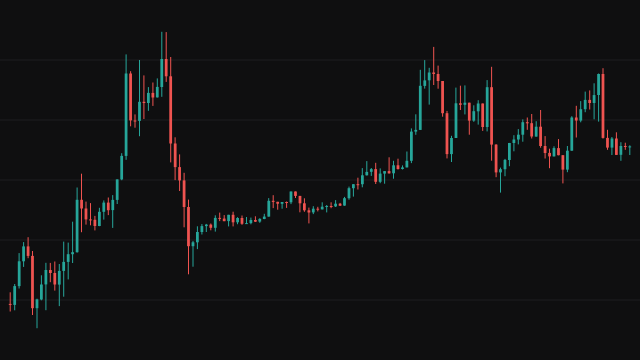
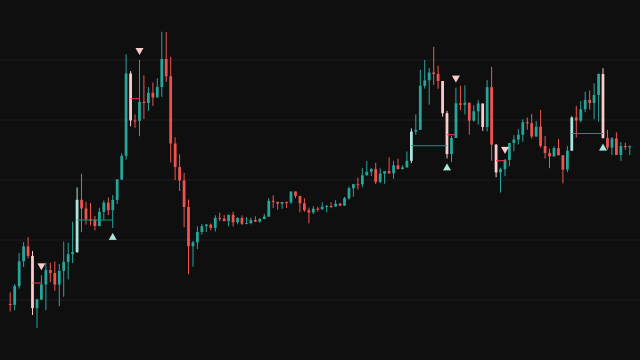
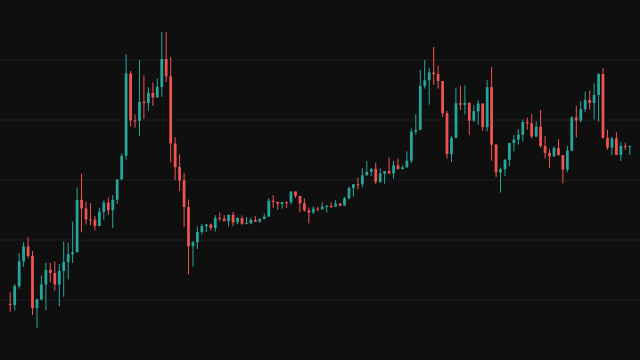
A liquidity void is a range of price that two candles of the same direction left untraded between them. A bearish void forms on a rising candle whose high is at or below the low of the previous rising candle. A bullish void is the mirror image: a falling candle whose low is at or above the high of the previous falling candle. Each void is drawn as a shaded box between the two candles, red for bearish and green for bullish, with a level line at the far edge, at the 0.79 retracement from the near edge, or at the midpoint.
The candles can come from a longer timeframe than the chart's. The study folds the chart's own bars into buckets of the chosen length (minutes, hours, days, weeks or months) and runs the test on those buckets, so a 4 hour void can be read on an hourly chart. Calendar days, weeks and months are counted in Indian time, and a week starts on Monday. The bucket that holds the newest bar is still forming, so it moves and clears drawings but never creates a void.
A height filter drops narrow voids: a void must be taller than the bucket timeframe's average true range times a multiplier, or taller than a percentage of its far edge. Each box and line stretches right with every bucket until a bucket's range reaches it, and is then frozen there. Only the newest Show Last voids of each side are kept.
How to read Liquidity Void Multi-timeframe
Read a void as a stretch of price the market skipped on the chosen timeframe. A box or line that is still stretching to the newest bar marks a gap price has not returned to; a frozen one shows where price first came back. The level line, at the far edge, the 0.79 retracement or the midpoint depending on Source, is the price many traders watch for a reaction when price returns.
Voids from a longer timeframe are fewer and larger, and they are usually treated as more important than the chart's own. Because the test needs a finished bucket, a void appears only once the bucket that formed it has closed. With the default filter of four times the average true range, only very large gaps qualify; choose Percentage and set it to 0 to see every void.
Settings
- Timeframe
- The timeframe the voids are measured on. Leave it empty for the chart's own bars. A bare number is minutes (15, 60), and a suffix names the unit: 1h, 4h, D, 2D, W or M for months.
- Show Last
- How many of the most recent voids of each side keep their box and line on the chart. At 0 no voids are drawn.
- Source
- Where the level line sits inside each void: the far edge, the 0.79 retracement measured from the near edge, or the midpoint.
- Bearish
- Find and draw bearish voids, the gaps between two rising candles of the chosen timeframe.
- Bullish
- Find and draw bullish voids, the gaps between two falling candles of the chosen timeframe.
- Hide Crossed
- Remove a void's line as soon as a bucket's range reaches its level, and remove its box once a bucket's range reaches the box's far edge, rather than leaving them frozen on the chart.
- Filter Using
- How narrow voids are dropped: by comparing the void's height with the average true range of the chosen timeframe, or with a percentage of its far edge.
- ATR Period
- The number of buckets in the average true range the ATR filter reads. Used only when Filter Using is ATR.
- ATR Multiplier
- A void must be taller than the average true range times this number. Higher values keep only the larger voids.
- Percentage Above
- With the Percentage filter, a void must be taller than this percentage of its far edge. Set it to 0 to keep every void.
Frequently asked questions
Which timeframe codes does it read?
A bare number is minutes, so 15 and 240 are 15 minutes and 4 hours. A suffix names the unit: s for seconds, m or min for minutes, h for hours, D for days, W for weeks and an upper-case M for months, with an optional number in front such as 2D. An empty or unreadable code uses the chart's own bars.
Why does a new void appear only after the bucket has closed?
A void is defined by a finished candle of the chosen timeframe. The bucket that holds the newest bar is still forming, so the study waits for it to close before it can create a void from it. It still freezes or clears existing drawings as that bucket trades.
Why are there so few voids on my chart?
The default filter keeps only voids taller than four times the average true range of the chosen timeframe. Lower the ATR Multiplier, or choose Percentage and set it to 0, to see more.