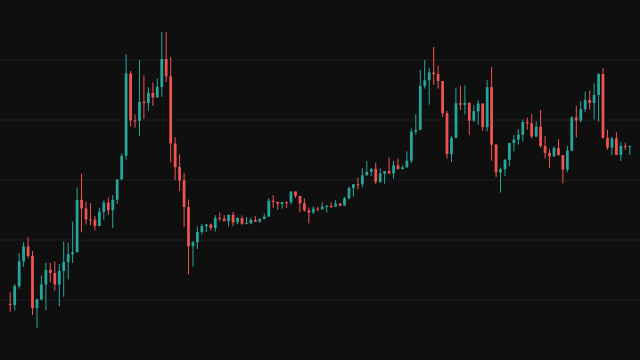
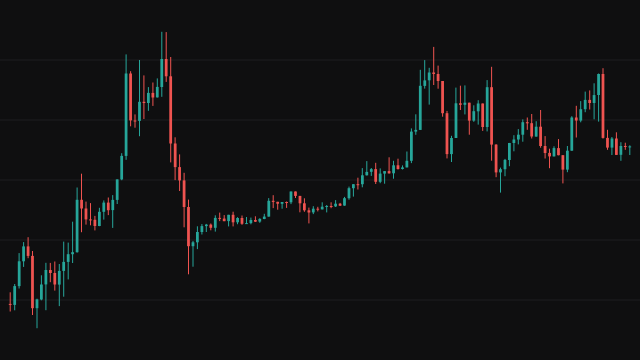
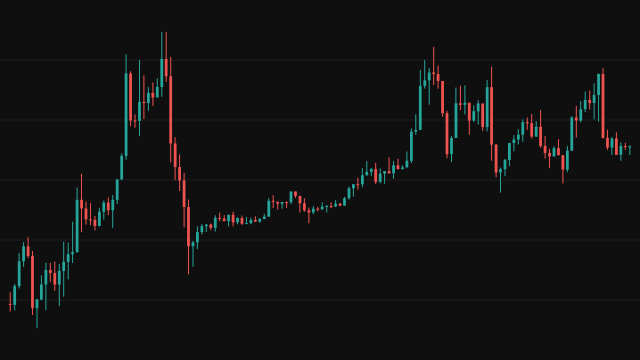
A liquidity void here is a range of price that two candles of the same direction left untraded between them. A bearish void forms on a rising candle whose high is at or below the low of the previous rising candle, so price jumped down between them. A bullish void is the mirror image: a falling candle whose low is at or above the high of the previous falling candle. Each void is drawn as a shaded box between the two candles' near edges, red for bearish and green for bullish, with a level line drawn across it.
The level sits at the far edge of the void (High/Low), at the 0.79 retracement from the near edge (OTE 0.79%), or at the midpoint (50%). A height filter drops narrow voids: either the void must be taller than the average true range times a multiplier, or taller than a percentage of the far edge. Each box and line stretches right with every new bar until a bar's range reaches it, and is then frozen at that bar. Only the newest Show Last voids of each side are kept.
The study also watches the newest void level of each side. An H is marked above a bar whose high rises through the newest bearish level, and an L below a bar whose low falls through the newest bullish level.
How to read Liquidity Void Screener
Read a void as a stretch of price the market skipped. Price may come back to such a range later, and a box that is still stretching to the right is a void price has not returned to yet. A frozen box or line shows where price first came back. The level line, at the far edge, the 0.79 retracement or the midpoint depending on Source, is the price many traders watch for a reaction when that return happens.
The H and L marks flag the bars where price crossed back through the newest void level, which can be read as the void being filled or tested. They are signals about the most recent void of each side only. The filter matters a great deal: with the default four times the average true range only very large gaps qualify, so on a calm market there may be few or no voids on the chart. Choose Percentage and set it to 0 to see every void.
Settings
- Show Last
- How many of the most recent voids of each side keep their box and line on the chart. At 0 no voids are drawn, though the signals still fire.
- Source
- Where the level line sits inside each void: the far edge, the 0.79 retracement measured from the near edge, or the midpoint. The signals use this level too.
- Bearish
- Find and draw bearish voids, the gaps between two rising candles. Turning it off also stops the H signals, which need a bearish level.
- Bullish
- Find and draw bullish voids, the gaps between two falling candles. Turning it off also stops the L signals, which need a bullish level.
- Hide Crossed
- Remove a void's line as soon as a bar's range reaches its level, and remove its box once a bar's range reaches the box's far edge, rather than leaving them frozen on the chart.
- Filter Using
- How narrow voids are dropped: by comparing the void's height with the average true range, or with a percentage of its far edge.
- ATR Period
- The length of the average true range the ATR filter reads. Used only when Filter Using is ATR.
- ATR Multiplier
- A void must be taller than the average true range times this number. Higher values keep only the larger voids.
- Percentage Above
- With the Percentage filter, a void must be taller than this percentage of its far edge. Set it to 0 to keep every void.
- Direction
- Both shows H and L signals. Bullish shows only the H signals, where price rises through a bearish level. Bearish shows only the L signals, where price falls through a bullish level.
- Only Bullish
- Show the L signals, the bars whose low falls back through the newest bullish void level.
- Only Bearish
- Show the H signals, the bars whose high rises back through the newest bearish void level.
Frequently asked questions
Why are there so few voids on my chart?
The default filter keeps only voids taller than four times the 14-bar average true range, which is a large gap on most instruments. Lower the ATR Multiplier, or choose Percentage and set it to 0 to see every void.
Which void does a signal refer to?
Only the newest void of each side. When a new bullish void forms, its level replaces the previous one, and an L marks the next bar whose low falls through that new level. If an H and an L would fall on the same bar, only the L is marked.
Why does a box stop stretching before price has filled it?
A box is frozen as soon as a bar's range reaches its near edge, the side next to the candle that created it. Price may not have reached the far edge yet. With Hide Crossed on, the box is removed once price reaches the far edge too.