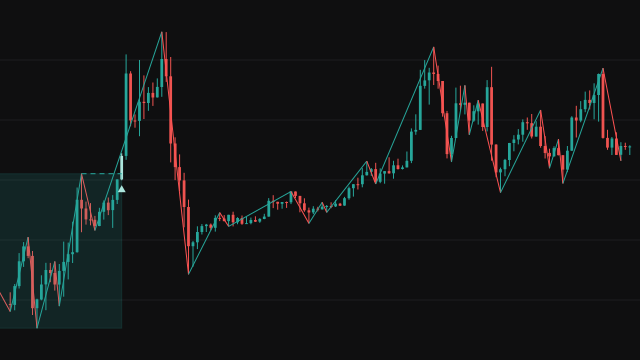
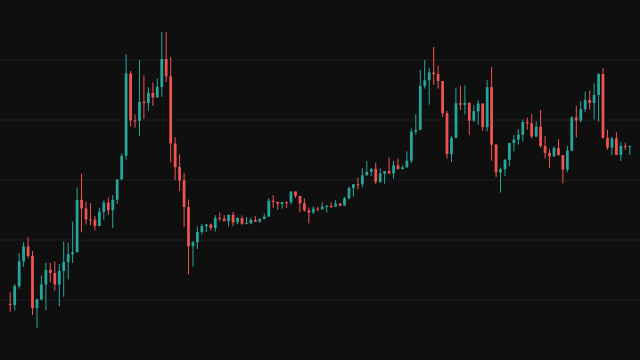
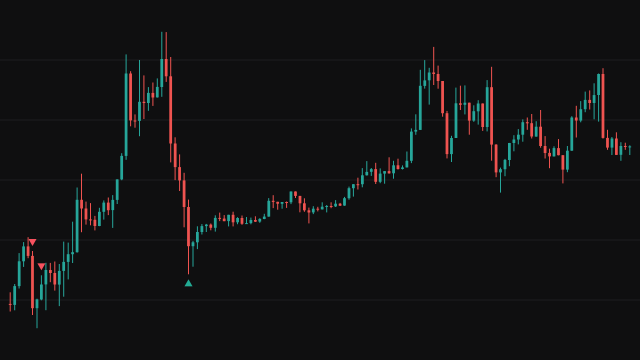
The study builds a zig zag of swing highs and lows. A bar is a swing high when its high (or the top of its body, with the Open/Close source) is the highest of the last Zig Zag Length bars, and a swing low is the mirror image. A lone swing high turns the direction up and a lone swing low turns it down. On a change of direction a new pivot is added; while the direction holds, a further extreme moves the newest pivot to the new price. The study keeps the newest five pivots and reads three swings from them, counted from the oldest held, so with five pivots they are the second, third and fourth newest.
A bearish shift needs the newest of those three swings to be the highest, the middle one to be the lowest, and the close to sit below all three after crossing down through the middle swing on this bar. A bullish shift is the mirror image. The swing displacement must also clear a filter: either the newest swing leg is more than Multiplier times the one before it, or the move from the oldest swing to the newest is larger than Percentage Above percent of the oldest swing's price.
Each shift sets a retracement level a third of the way back from the newest swing toward the broken middle swing. The first bar, from the shift bar on, whose high crosses up through a bearish level (or whose low crosses down through a bullish one) completes the sequence and is marked as the retracement. A further shift before that moves the level to the new swings. Shifts and retracements are only taken on closed bars.
How to read Market Structure Shift (MSS)
A pink triangle above a candle, with the candle painted pink, is a bearish shift: price has closed back below the swing low that the last push higher started from, which suggests the up move has failed. A green triangle below a green candle is the bullish version. The shaded box runs from the oldest of the three swings to the newest, in both time and price, and the dashed line runs along the broken swing to the shift bar. An R marks the first bar that comes back to the retracement level, one third of the last leg below the newest swing high (above the newest swing low for a bullish shift), which is the follow-up entry the method looks for. A dotted line marks that level.
The newest pivot keeps moving while price extends in its direction, and the three swings are read from the pivots behind it, so a shift is only called once a newer swing has formed and a close has come back through the middle one. A shift can fail and be followed by a shift the other way; a wider filter gives fewer, larger structures. Turn on Show Zig Zag to see the swings the study is reading.
Settings
- Bearish
- Show everything on the bearish side: shift markers, retracement markers, candle colours, boxes and lines.
- Bearish Shift
- Show the bearish shift marker, its candle colour and the dashed line along the broken swing.
- Bearish Retracement
- Show the bearish retracement marker, its candle colour and its dotted level.
- Bullish
- Show everything on the bullish side: shift markers, retracement markers, candle colours, boxes and lines.
- Bullish Shift
- Show the bullish shift marker, its candle colour and the dashed line along the broken swing.
- Bullish Retracement
- Show the bullish retracement marker, its candle colour and its dotted level.
- Zig Zag Length
- How many bars a swing high or low must top or undercut. Larger values find fewer, wider swings.
- Source
- High/Low reads the candle's wicks for the swings; Open/Close reads the top and bottom of its body.
- Show Zig Zag
- Draw the path through every swing pivot the study has found, up to the newest 500.
- Box Transparency
- How faint the swing range box is: 0 is solid and 100 is invisible.
- Filter Using
- Multiplier compares the newest swing leg with the one before it; Percentage compares the move with the price of the oldest swing.
- Multiplier
- With the Multiplier filter, how many times larger the newest swing leg must be than the previous one.
- Percentage Above
- With the Percentage filter, the smallest move from the oldest to the newest swing, as a percentage of the oldest swing's price. 0 turns the filter off.
Frequently asked questions
Why does a shift appear several bars after the swing it breaks?
A shift needs three swings plus the later close through the middle one. With five pivots held, those three are the second, third and fourth newest, so a newer swing has to form first. The marker sits on the bar where the close came back through.
What does the R marker mean?
It is the first bar after a shift that trades back to the level one third of the last swing leg short of the newest swing. At most one R follows a shift, and a further shift before it arrives replaces the level. The dotted line runs from the newest swing to the R bar at that level.
Why do I see fewer shifts on the Percentage filter?
The default 0.7 percent asks for a move of 0.7 percent of the oldest swing's price, which removes the narrow structures. Set it to 0 to take every shift the swing pattern allows.