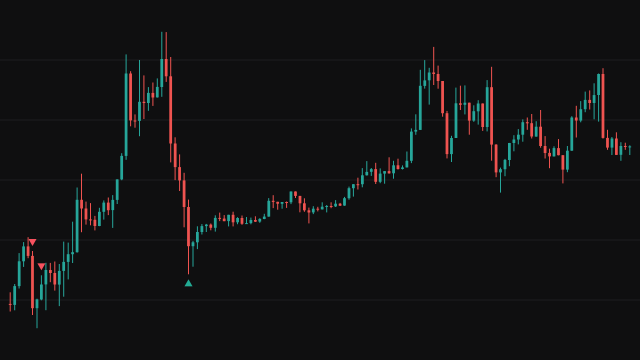
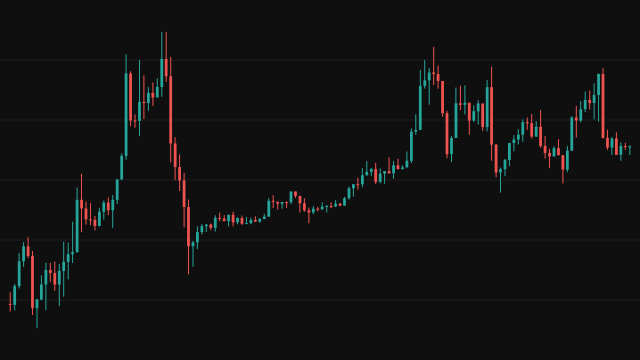
The study builds a zig zag from swing extremes. A bar is a swing high when its high is the highest of the last Zig Zag Length bars, and a swing low when its low is the lowest. A new swing in the opposite direction starts a new pivot, and a further extreme in the same direction moves the newest pivot rather than adding one. The source of the swings can be the high and low, the larger of open and close, or the close alone.
On every bar the newest nine pivots are compared with each other. A short setup is an advance that tops out: the swings rise to a peak, then price makes a lower high, a low below the previous swing low, and another lower high, while the newest swing is still forming. A long setup is the mirror image. When that shape is in place and the close crosses the price of that last swing low (or, for a long, the last swing high), the bar is a shift. The study draws a box over the whole structure, a dashed line at the broken pivot's price, colours the candle and marks the bar.
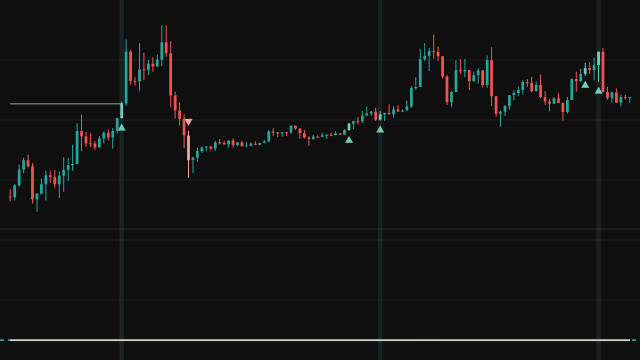
The Retracement method uses the same shift to arm the broken level, then waits for price to come back to it: for a short, the first bar whose high rises above the level after the previous high stayed below it. That bar is marked, coloured and joined to the level with a dotted line. A set of optional filters (day change, day volume, volume change, ATR, body size, volume average, relative volume, time of day and date) can hold back signals. A small table on the newest bar shows the day's percentage change, the day's volume change, the day's volume and the previous day's volume.
How to read Mitigation Block Scanner
A pale red triangle above a bar is a bearish shift: the swing structure turned down and the close broke below its last swing low. A pale green triangle below a bar is the bullish shift. The shaded box shows the swings that formed the pattern, and the dashed line marks the level that was broken. With the Retracement method, an arrow marks the bar where price comes back to that level instead of the break, and a dotted line joins it to the level.
The pattern is strict, so signals are rare, and the zig zag only knows a pivot is final when price swings the other way, so the newest segment can still move. A shift is a description of structure, not a forecast: it can fail, and the filters only narrow the bars where it is allowed to fire.
Settings
- Screening Method
- Mitigation Block marks the shift bar itself. Retracement marks the later bar where price returns to the level the shift broke.
- Long Signals
- Show the bullish shifts or retracements, with their boxes, lines, markers and candle colours.
- Short Signals
- Show the bearish shifts or retracements, with their boxes, lines, markers and candle colours.
- Display Zig Zag
- Draw the zig zag that joins the pivots. The pattern is still read when the line is hidden.
- Zig Zag Length
- The window, in bars, that a swing high must be the highest of and a swing low the lowest of. A longer length gives fewer, larger swings.
- Source
- What the swings are measured on: the high and low, the larger of open and close, or the close.
- Box Transparency
- Transparency of the structure box, from 0 for solid to 100 for invisible.
- Apply % Change Filter
- Requires the day's change to be both above the positive and below the negative threshold at once. No bar can meet both, so switching it on suppresses every signal.
- % Change Above/Below +/-
- The day change threshold, in percent, used by the % change filter.
- Apply Volume Filter
- Only allow signals while the day's running volume is at least the Volume Above value.
- Volume Above
- The day volume the volume filter requires. The first day on the chart has no running total, so it never passes.
- Apply Volume % Change Filter
- Only allow signals while the day's running volume is up by at least the given percentage on the previous day's total.
- Volume % Change Above
- The volume change, in percent against the previous day, that the volume change filter requires.
- Apply ATR Filter
- Only allow signals on bars whose high to low range is wider than the ATR times the multiplier.
- ATR Length
- The number of bars in the average true range used by the ATR filter.
- ATR Multiplier
- How many ATRs wide a bar must be to pass the ATR filter.
- Apply Body % Filter
- Only allow signals on bars whose body is at least the given share of the bar's range.
- Body % Above
- The body as a percentage of the range that the body filters require. A bar with no range fails.
- Apply Body Size Filter
- Requires the body test above and a range at least the multiplier times the previous bar's range.
- Body Size Multiplier (x)
- How many times the previous bar's range this bar's range must be to pass the body size filter.
- Apply Volume SMA Filter
- Only allow signals on bars whose volume is above its simple moving average.
- Volume SMA Length
- The number of bars in the volume average used by the volume SMA filter.
- Apply Relative Volume Filter
- Only allow signals when relative volume, this bar's volume over the previous bar's volume average, is above its own average times the multiplier.
- Relative Volume Length
- The number of bars in both the volume average and the relative volume average.
- Rel Vol SMA Multiplier
- How many times its own average the relative volume must be to pass the filter.
- Apply Time Filter
- Only allow signals on bars that open inside the time window, in the chart's timezone.
- Time From (hour)
- The hour the time window opens, compared with the time each bar opens.
- Time From (minute)
- The minute the time window opens. A bar opening at this minute is inside the window.
- Time To (hour)
- The hour the time window closes.
- Time To (minute)
- The minute the time window closes. A bar opening at this minute is already outside it.
- Apply Date Filter
- Only allow signals on bars of one calendar date, in the chart's timezone.
- Day
- The day of the month the date filter accepts.
- Month
- The month, 1 to 12, the date filter accepts.
- Year
- The year the date filter accepts.
- Display Table
- Show the panel with the day's change, the day's volume change, the day's volume and the previous day's volume.
- Position
- Where the panel sits. Panels pin to the four corners, so a top position goes to the top and a middle or bottom one to the bottom, on the left for a left position and on the right otherwise.
- Size
- The panel's text size. Tables in this version draw at the chart's own text size, so changing it has no visible effect.
Frequently asked questions
Why are there so few signals?
The short and long setups each test more than twenty relations between the newest nine pivots, and the close must then cross the pattern's last swing low or high on that very bar. On two months of hourly bars the default settings mark only about a dozen bars. Changing the Zig Zag Length changes which swings count as pivots, and so which bars qualify; a shorter length does not always give more signals.
What is the difference between the two methods?
Mitigation Block marks the bar where the close breaks the level, with a box over the structure and a dashed line at the level. Retracement keeps the same boxes but marks the later bar where price comes back to the broken level, joined to it by a dotted line. The retracement only counts the first return after each shift.
Why does switching on the % change filter remove every signal?
That filter requires the day's change to be above the positive threshold and below the negative threshold on the same bar, which cannot happen. The study keeps the test exactly as it is defined, so leave it off unless you want to silence the signals.
Why does the newest part of the zig zag move?
A pivot is only final once price swings the other way by the Zig Zag Length rule. Until then, a further high in an up leg or a further low in a down leg moves the newest pivot, and its segment follows it. Signals are only taken on closed bars.