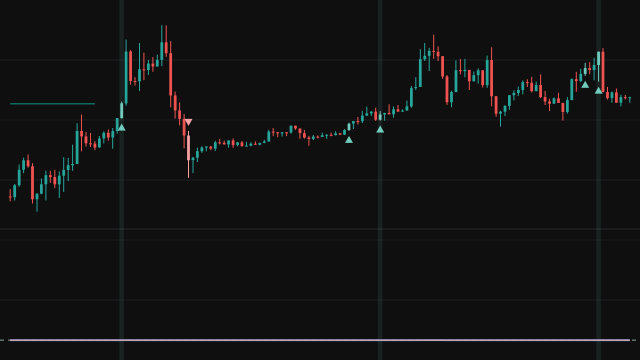
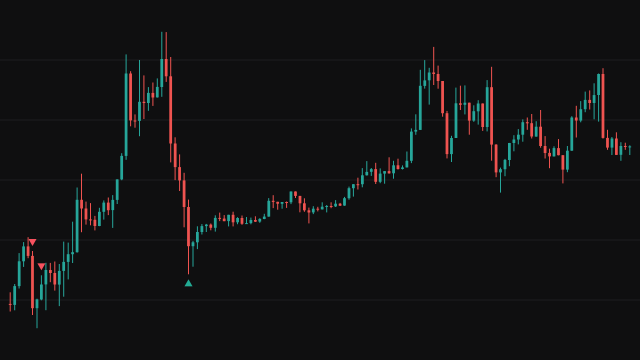
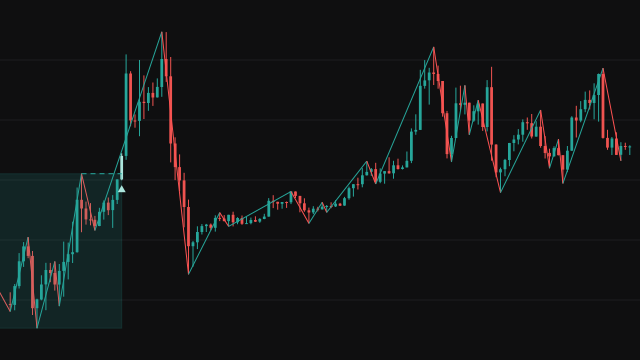
Note. The Signal Level line is filled in 80 bars late and drawn back over the bars it covers, so the newest 80 bars never show it and a span longer than 81 bars shows only its last 81 bars, because a study cannot repaint earlier bars once a setup completes.
The scanner runs a small state machine on an RSI (14 bars by default) and a simple average of that RSI (also 14 bars by default). A long setup starts when RSI crosses above 60 while it is above its average; that candle's high becomes the break level. RSI then has to dip back below 60, and the setup completes on the first settled bar that closes above the break level while RSI is again above 60 and above its average. A short setup is the mirror image around 40, using the low of the crossing candle. A new crossing on the other side cancels a setup that is still waiting.
The six scanning methods read that machine in different ways. Continuous Break marks the crossing candle (a circle) and the break (a triangle marked 2). Continuous Retracement also marks the first bar from the break onward whose high (for a short) or low (for a long) crosses back through a Fibonacci level of the breaking candle, set by Fib Value (marked 3). Flip Break and Flip Retracement keep only the breaks or retracements that change side from the previous one. Divergence and Hidden Divergence ignore the machine and join RSI pivots with a line in the RSI pane when price and RSI disagree: a lower price low with a higher RSI low is bullish, a higher price high with a lower RSI high is bearish, and the hidden forms are the reverse pairs.
Optional filters can veto the break bar: the day's running percentage change, the day's cumulative volume or its change against the previous day, the candle's range against the average true range or against the previous candle's range, the share of the range taken by the body, the bar's volume against its average, relative volume, a clock window and a single calendar date. Days are calendar days in the chart's timezone. A small table on the newest bar shows the day's running percentage change (the sum of the bar-to-bar percentage changes of the close since the day began), today's volume so far against the previous day's total in percent, and both days' volume in lakhs (units of 100,000).
How to read RSI Directional Momentum Scanner
In the RSI pane, the blue line is RSI and the orange line its average, with the 60 to 40 band shaded and dotted lines at 70, 50 and 30. On the bars, a circle is a fresh crossing that starts a setup, a triangle marked 2 is a completed break and a triangle marked 3 is the retracement entry; marks above the bar and a red tint are short, marks below and a green tint are long. Breaks and retracements also shade the background, and every marked bar is recoloured.
The Signal Level line on the price chart shows the break level from the setup candle to the break, or the Fibonacci level from the break to the retracement. It is drawn 80 bars behind the newest bar, because a span is only known once its setup completes, so the newest setups show their marks long before their level line. A break is only taken on a settled bar, and none of the marks is a forecast; treat them as candidates to study, not as instructions.
Settings
- Scanning Method
- Which signals the scanner marks: the break, the retracement, only side flips of either, or classic or hidden RSI divergence.
- Long Signals
- Show the long marks, bar colours and background shading. Turning it off hides them without changing the calculation.
- Short Signals
- Show the short marks, bar colours and background shading. Turning it off hides them without changing the calculation.
- RSI Length
- The number of bars in the RSI. Longer settings cross 60 and 40 less often, so setups are fewer and slower.
- RSI Source
- The price series the RSI is computed from, close by default.
- SMA Length
- The length of the simple average of RSI that a setup and its break must sit on the right side of.
- Fib Value
- Where in the breaking candle the retracement level sits: 0 is the low of a long breaking candle and the high of a short one, 1 the opposite edge and 0.5 the midpoint.
- Display Bullish Divergence
- In Divergence mode, draw the lines for a lower price low with a higher RSI low.
- Display Bearish Divergence
- In Divergence mode, draw the lines for a higher price high with a lower RSI high.
- Display Hidden Bullish Divergence
- In Hidden Divergence mode, draw the lines for a higher price low with a lower RSI low.
- Display Hidden Bearish Divergence
- In Hidden Divergence mode, draw the lines for a lower price high with a higher RSI high.
- Pivot Lookback Right
- Bars after an RSI pivot that must confirm it. A pivot, and any divergence line ending at it, appears this many bars late.
- Pivot Lookback Left
- Bars before an RSI pivot that must sit above a low pivot or below a high pivot.
- Max of Lookback Range
- The most bars allowed between the previous pivot and the current one for the pair to count as a divergence.
- Min of Lookback Range
- The fewest bars allowed between the previous pivot and the current one for the pair to count as a divergence.
- Apply % Change Filter
- Requires the day's change to be above the figure below and below its negative at once, so turning it on stops every break and retracement.
- % Change Above/Below +/-
- The day percentage change threshold used by the change filter, in both directions.
- Apply Volume Filter
- Allow a break only when the volume traded so far today is at least the figure below.
- Volume Above
- The cumulative day volume the volume filter requires, in units of the instrument.
- Apply Volume % Change Filter
- Allow a break only when today's volume so far has grown by at least the figure below against the previous day's total.
- Volume % Change Above
- The volume growth in percent the volume change filter requires. 0 means today must already exceed the previous day.
- Apply ATR Filter
- Allow a break only on a candle whose range is larger than the average true range times the multiplier.
- ATR Length
- The number of bars in the average true range used by the ATR filter.
- ATR Multiplier
- How many average true ranges the breaking candle's range must exceed when the ATR filter is on.
- Apply Body % Filter
- Allow a break only on a candle whose body covers at least the stated share of its range.
- Body % Above
- The share of the candle's range, in percent, that the body must cover for the body filters.
- Apply Body Size Filter
- Allow a break only on a candle that passes the body share test and whose range is at least the multiplier times the previous candle's range.
- Body Size Multiplier (x)
- How many times the previous candle's range the breaking candle must span when the body size filter is on.
- Apply Volume SMA Filter
- Allow a break only on a bar whose volume is above the simple average of volume.
- Volume SMA Length
- The number of bars in the volume average used by the volume average filter.
- Apply Relative Volume Filter
- Allow a break only when relative volume, this bar's volume over the previous bar's volume average, is above its own average times the multiplier.
- Relative Volume Length
- The length of the volume average and of the relative volume average used by the relative volume filter.
- Rel Vol SMA Multiplier
- How many times its own average the relative volume must reach when the relative volume filter is on.
- Apply Time Filter
- Allow a break only between the From and To times below, read on the chart's clock. The To time itself is excluded.
- Time From (hour)
- The hour the time window opens, 0 to 23, on the chart's clock.
- Time From (minute)
- The minute the time window opens, added to the From hour.
- Time To (hour)
- The hour the time window closes, 0 to 23, on the chart's clock.
- Time To (minute)
- The minute the time window closes, added to the To hour.
- Apply Date Filter
- Allow a break only on the single calendar date set below, in the chart's timezone.
- Day
- The day of the month the date filter accepts.
- Month
- The month, 1 to 12, the date filter accepts.
- Year
- The year the date filter accepts.
- Display
- Show the table of the day's change and volume on the newest bar.
- Position
- Where the table sits. The grid can only pin to a corner, so the left positions use a left corner, the others a right corner, and the middle row uses the top corners.
Frequently asked questions
Why does a setup sometimes never complete?
A setup waits until price closes beyond the crossing candle while RSI is back on the right side of 60 or 40 and of its average. If RSI crosses the opposite band first, the waiting setup is replaced by one on the other side, and nothing is marked for the old one.
Why is the Signal Level line missing on the newest bars?
The line covers the bars from a setup candle to its break, which are only known once the break happens. The study fills the line in 80 bars later and draws it back over the bars it describes, so the newest 80 bars show the marks and colours but not the line.
What does the Flip method add over the Continuous methods?
Flip Break marks a break only when it is on the opposite side from the previous break, and Flip Retracement does the same for retracements. A run of breaks on one side gives one mark instead of many, and the very first break on the chart is never marked.
Why does turning on the % Change Filter stop every break?
The filter asks for the day's running change to be above the threshold and below its negative on the same bar, which cannot happen, so no break, retracement or flip is ever marked. The circles that start a setup do not pass through the filters, so they still appear in the two Continuous modes.