Note. The break and retracement guide levels are drawn 120 bars after the bar they belong to, because a plot cannot write onto bars already drawn, so the newest 120 bars show no guide yet and a sequence longer than 120 bars loses its oldest part; with a Pivot Lookback Right above 5 each divergence point lands that many bars minus 5 after its pivot, because a plot's offset cannot be computed from a setting; the guides and the 60 and 40 band lines are solid, because a plot has no dotted style; and the table always sits bottom right at the standard text size, because a table offers only four corners and no text size.
The study draws a standard RSI with a simple moving average of the RSI, a shaded band between 60 and 40, and dotted reference levels at 70, 50 and 30. On top of that pane it runs a scanner that looks for one of six setups, chosen with the Scanning Method menu.
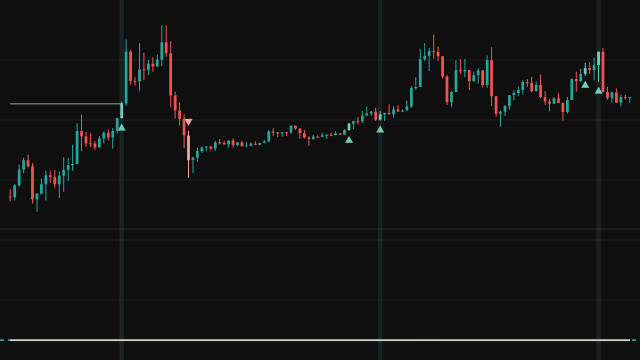
Continuous Break is a three-step state machine. On the short side, step one is RSI crossing below 40 while it is under its own average; the low of that breaking candle is remembered. Step two is RSI climbing back above 40. Step three is a confirmed bar that closes below the remembered low while RSI is again below 40 and below its average, and while every enabled filter passes. The long side is the mirror image around 60 and the high of the breaking candle. A guide line on the price chart runs from the breaking candle to the signal bar at the level that was broken. Continuous Retracement goes one step further: after a signal it waits for price to cross back into the signal candle at the Fib Value fraction of its range, and draws that level as a guide. Flip Break and Flip Retracement report only the signals that change side, so a run of shorts shows once.
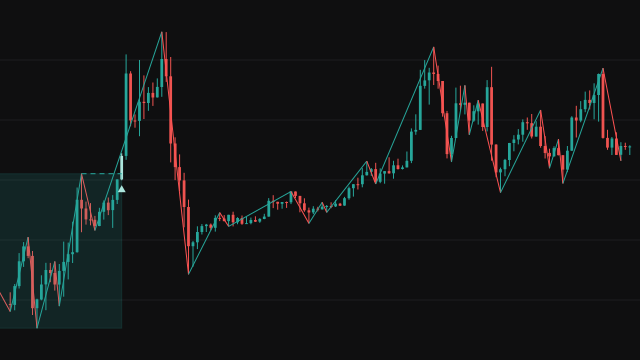
Divergence and Hidden Divergence use RSI pivots found with the left and right lookbacks. A regular bullish divergence is a lower price low with a higher RSI low; a hidden bullish divergence is a higher price low with a lower RSI low, and the bearish cases mirror them on pivot highs. The previous pivot must sit between the minimum and maximum lookback range. Every pivot is plotted on the RSI pane and on price, and only the pivots that complete the chosen divergence are coloured; the others are drawn fully transparent. A small table in the corner shows the running day's percentage change, its volume, the change in volume against the previous day, and the previous day's volume, with both volumes shown in lakhs (units of 100,000).
How to read RSI Directional Momentum
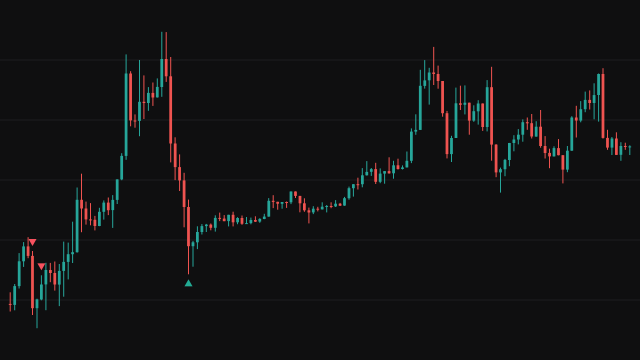
In the continuous modes a circle above the bar marks a short step one and a circle below marks a long step one; a triangle marked 2 is the completed break and a triangle marked 3 is the retracement entry. The numbered bars are also recoloured and lightly shaded; a step one bar is recoloured but not shaded. Treat step one as a warning that momentum has turned, and the numbered marks as the setup the scanner exists to find. The divergence modes add no markers: read the coloured pivot points on the RSI pane and on price.
The marks are mechanical. They do not judge trend, support or news, and a break can fail on the next bar. The extra filters (day change, volume, ATR, body size, relative volume, time and date) only remove signals; the day change filter as written needs the day to be above +N and below -N at once, so switching it on removes every signal. Because the guide levels are only known once a sequence completes, they appear on the chart 120 bars after the bar they belong to, so the newest stretch of the chart shows the markers but not yet their guides.
Settings
- Scanning Method
- Which setup the scanner looks for: the continuous break, its retracement, the two flip versions that report only changes of side, or regular or hidden RSI divergence.
- Long Signals
- Show the long side markers, bar colours and shading of the scanner.
- Short Signals
- Show the short side markers, bar colours and shading of the scanner.
- RSI Length
- Number of bars in the RSI. A shorter length makes RSI cross 60 and 40 more often, so the scanner finds more sequences.
- RSI Source
- The price series the RSI is computed from, the close by default.
- SMA Length
- Length of the simple average of the RSI that each step compares RSI against.
- Fib Value
- Where in the signal candle the retracement level sits: 0 is the low of a long signal candle and the high of a short one, 1 the other end, 0.5 the midpoint.
- Display Bullish Divergence
- In Divergence mode, colour the legs where price made a lower low and RSI a higher low.
- Display Bearish Divergence
- In Divergence mode, colour the legs where price made a higher high and RSI a lower high.
- Display Hidden Bullish Divergence
- In Hidden Divergence mode, colour the legs where price made a higher low and RSI a lower low.
- Display Hidden Bearish Divergence
- In Hidden Divergence mode, colour the legs where price made a lower high and RSI a higher high.
- Pivot Lookback Right
- Bars after an RSI pivot that must stay above (or below) it. A pivot is confirmed this many bars late. Points are drawn on their pivot for values up to 5, though below 5 the newest point appears 5 bars after its pivot rather than this many; above 5 each point lands that many bars minus 5 after its pivot.
- Pivot Lookback Left
- Bars before an RSI pivot that must stay above (or below) it. Larger values find fewer, more significant pivots.
- Max of Lookback Range
- The furthest back, in bars, the previous pivot may be for a divergence to count.
- Min of Lookback Range
- The nearest, in bars, the previous pivot may be for a divergence to count.
- Apply % Change Filter
- Require the running day's percentage change to be above +N and below -N. Both at once cannot hold, so switching this on blocks every completed signal.
- % Change Above/Below +/-
- The N, in percent, for the day change filter.
- Apply Volume Filter (Day Total)
- Require the running day's total volume to reach the level set below before a signal completes.
- Volume Above
- The day total volume the volume filter asks for.
- Apply Volume % Change Filter
- Require the running day's volume to be up on the previous day's total by at least the percentage below.
- Volume % Change Above
- The volume change, in percent against the previous day, that the filter asks for. 0 means simply more than the previous day.
- Apply ATR Filter
- Require the signal candle's range to exceed the ATR times the multiplier, which keeps only wide candles.
- ATR Length
- Number of bars in the average true range used by the ATR filter.
- ATR Multiplier
- How many ATRs the signal candle's range must exceed when the ATR filter is on.
- Apply Body % Filter
- Require the candle body to cover at least the set share of the candle's full range.
- Body % Above
- The share of the range, in percent, the body must cover. It is also used by the body size filter.
- Apply Body Size Filter
- Require a full-bodied candle whose range is at least the multiplier times the previous candle's range.
- Body Size Multiplier (x)
- How many times larger than the previous candle the signal candle must be for the body size filter.
- Apply Volume Filter (vs SMA)
- Require the signal candle's volume to be above its simple moving average.
- Volume SMA Length
- Number of bars in the volume average used by that filter.
- Apply Relative Volume Filter
- Require relative volume (volume over the previous bar's average volume) to exceed its own average times the multiplier.
- Relative Volume Length
- Number of bars in both averages behind the relative volume filter.
- Rel Vol SMA Multiplier
- How far relative volume must stand above its own average for the filter to pass.
- Apply Time Filter
- Allow signals only between the start and end times below, read in the chart's time zone.
- Time From (Hour)
- Hour at which the time window opens.
- Time From (Minute)
- Minute at which the time window opens.
- Time To (Hour)
- Hour at which the time window closes; a bar at the closing minute is outside it.
- Time To (Minute)
- Minute at which the time window closes.
- Apply Date Filter
- Allow signals only on the one calendar date set below, useful for studying a single session.
- Day
- Day of the month for the date filter.
- Month
- Month, 1 to 12, for the date filter.
- Year
- Year for the date filter.
- Display
- Show the table of the day's percentage change and volume readings.
- Position
- Kept with the other table settings; the table is always drawn in the bottom right corner of the pane in this version.
- Size
- Kept with the other table settings; the table is drawn at the chart's standard text size in this version.
Frequently asked questions
Why do the break and retracement guide lines appear late?
A guide runs back to the candle that started the sequence, and that is only known once the sequence completes. A plot cannot go back and fill bars it has already drawn, so the study holds each guide for 120 bars and then draws it on the bars it belongs to. The markers and bar colours are not delayed.
What do the numbers 2 and 3 on the markers mean?
2 marks the completed break, the third step of the sequence, where the close cleared the breaking candle. 3 marks the retracement, where price came back to the Fib Value level of that signal candle. The plain circles mark step one, the RSI break itself.
Why does turning on the % change filter remove every signal?
The rule asks for the day's change to be above +N and below -N at the same time, which cannot happen. It is kept as written so the study computes the same thing as its rules state.
Why are most divergence points invisible?
Every RSI pivot is plotted, but a point is coloured only when it completes the divergence the selected mode looks for, measured against the previous pivot inside the lookback range. The rest are drawn fully transparent.