Note. The table is drawn at the chart's own text size whatever Table Size says, and a middle row or centre column is drawn in the nearest corner, because a table here has no size setting and pins only to a corner.
The study looks for an order block in three numbered steps. Signal 1 is a momentum candle: its body is more than 66 percent of its range, its range is at least one 14-bar ATR (average true range), and it breaks the range of the previous Period candles. A bearish candle that makes a new low below the lowest low marks a long setup; a bullish candle that makes a new high above the highest high marks a short setup. Only the first such candle after the side changes counts.
Signal 2 is a later candle of the opposite colour that closes beyond the first candle: above its high for a long, below its low for a short, again with a range of at least one ATR. Signal 3 is the entry: after signal 2, price crosses back into the order block level, which is the first candle's high for a long or its low for a short. Vertical Offset pushes that level out by a share of the first candle's range, so price need not touch it exactly.
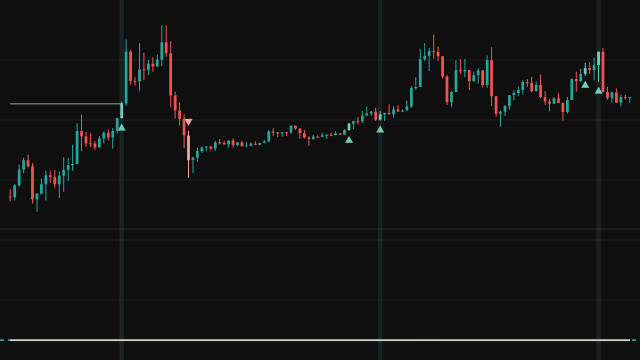
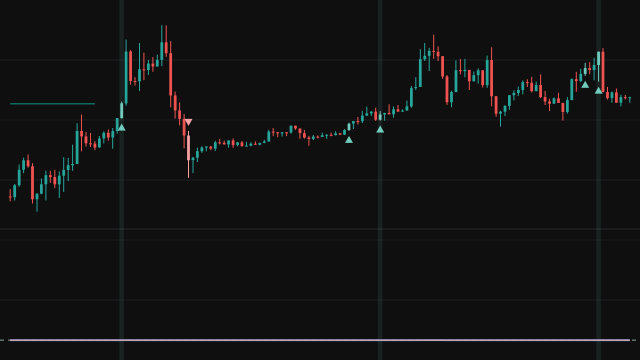
Each step is marked with a small numbered circle, below the candle for a long and above it for a short. A line is drawn from the newest first candle at its high or low and extended to the right, and a table lists the most recent third signals with their time, side and close.
How to read Retracement to Order Block with Screener
Read the numbers as a sequence. A 1 shows a strong candle that swept the recent range, a 2 shows price closing back through that candle, and a 3 shows price returning to the level the first candle left behind, which is where the setup expects an entry. A 3 never appears without a 1 and a 2 before it on the same side: each step waits for the step before it.
The extended line keeps the newest order block level on screen, and the table gives a quick list of the latest entries. The signals use only closed bars and fixed rules, so they say nothing about the size of the move that follows; a level that price cuts straight through is not a defended level.
Settings
- Period
- How many earlier candles the first candle must break the high or low of. A longer period asks for a larger sweep and gives fewer setups.
- Vertical Offset (%)
- Pushes the order block level out by this share of the first candle's range, so the third signal fires a little before an exact touch. 0 needs a precise touch.
- Direction
- Which sides the table lists: both, only long entries or only short entries. The markers are not affected.
- Only Bullish
- When off, long entries are left out of the table.
- Only Bearish
- When off, short entries are left out of the table.
- Display Rows
- How many of the most recent third signals the table lists. 0 leaves only the header.
- Table Position
- Where the table sits. Tables pin to a corner, so a centre column is drawn on the right and a middle row at the bottom.
- Table Size
- Kept for the text size of the table; the table is drawn at the chart's own text size in this version.
- Style
- Style of the order block line: solid, dashed or dotted.
- Width
- Thickness of the order block line, from 1 to 10.
Frequently asked questions
Why can signal 2 never appear on the same candle as signal 1?
Signal 2 must be a candle of the opposite colour to the first candle, closing beyond it, and the first candle cannot close beyond its own high or low. It always lands on a later candle.
What does the Vertical Offset do?
It moves the order block level away from the first candle by a share of that candle's range: above its high for a long, below its low for a short. At 50 the level sits half the candle's range beyond the extreme, so a shallower pullback is enough for signal 3.
Why is there only one line on the chart?
The line always shows the newest first candle's level. When a new first candle appears, the old line is removed and a new one is drawn from the new candle.
Which time zone does the table use?
The table writes each signal's time in the chart's own timezone, as hour and minute plus the date on an intraday chart, and the date alone on a daily one.