Mean Absolute %Error scores an exponential moving average as a forecast of price, in percent. The average is taken over Period bars and seeded with the simple average of its first Period values. On every bar the study divides the absolute gap between the source and the average by the source and multiplies by 100. A bar where the source is exactly zero carries no error.
The percentage errors are averaged over the last Period bars, counting only the bars that carry an error. The reading starts on the first bar where the average exists and widens its window until it is full.
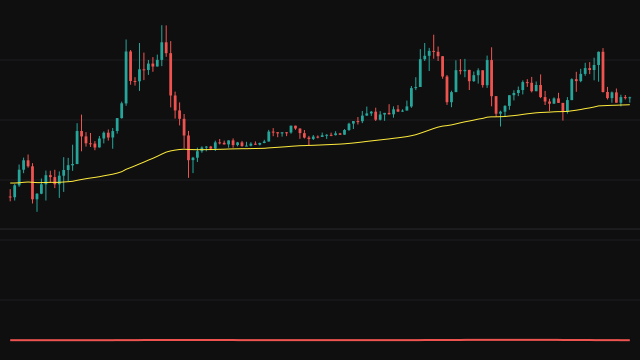
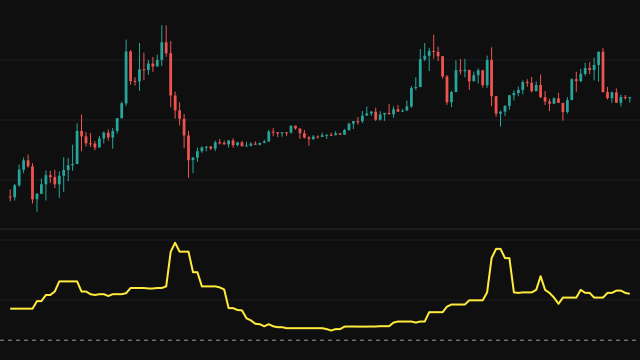
The error is plotted as a shaded area in its own pane, and the reference average is drawn on the price chart.
How to read Mean Absolute %Error (MAPE)
A reading of 2 means price has typically been 2 percent away from its average over the window. Because it is a percentage, it can be compared between instruments and across periods where the price level changed. A rising line means price is pulling away from its average; a falling one means it is settling back near it.
The reading has no sign, so it does not say which side of the average price is on. Look at the EMA on the price chart for that.
Settings
- Source
- The price series measured against its own average. The close by default.
- Period
- The length of the reference EMA and of the window the percentage error is averaged over.
Frequently asked questions
Why divide by price rather than by the average?
That is the usual definition of a percentage error, where the actual value is the base. The MAPD study divides by the average instead; the two readings are close unless price is far from its average.
Can the reading be negative?
No. It averages absolute percentage gaps, so it is zero or above. Use MPE for a signed version that shows bias.
When does the first value appear?
On the first bar where the EMA has a value, which is bar number Period counting from one. With the default of 100 that is the hundredth bar of the chart.