Mean Absolute Scaled Error scores an exponential moving average as a forecast of price, divided by a scale meant to come from a naive forecast. The average is taken over Period bars and seeded with the simple average of its first Period values. On every bar the study takes the absolute gap between the source and the average and divides it by the scale.
The scale is measured once, on the first bar of the chart, as the mean absolute one-bar change of the source over the window. On the first bar there is no earlier bar to compare with, so no change is counted and the scale is set to 1 for the whole chart. In practice the reading therefore equals the plain mean absolute error, in price units.
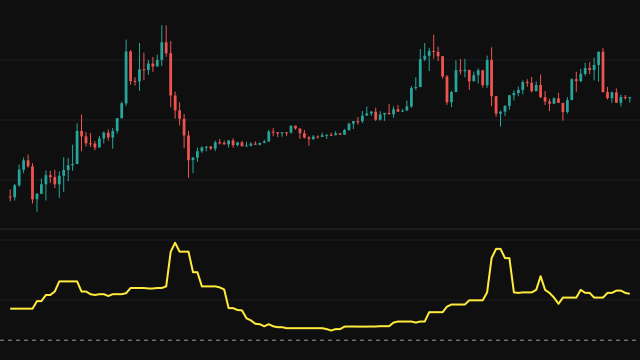
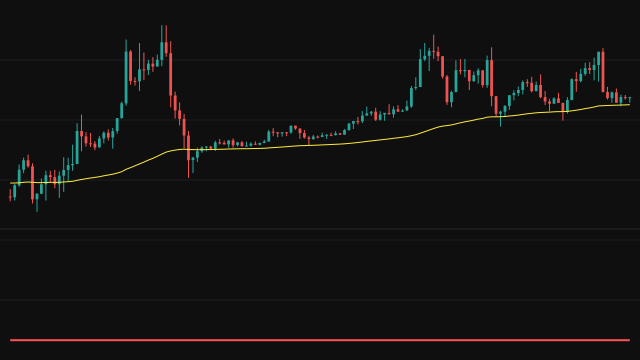
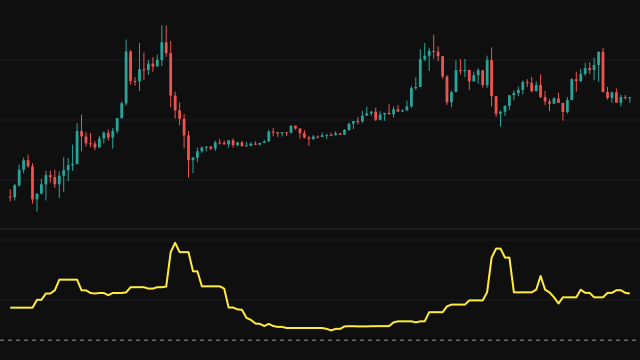
The scaled errors are averaged over the last Period bars, at most 4000, counting only the bars that carry an error. The error is plotted as a shaded area in its own pane, and the reference average is drawn on the price chart.
How to read Mean Absolute Scaled Error (MASE)
Read the value as the typical distance between price and its average over the recent past. A rising reading means price is pulling away from its average faster than before, which is common in a strong trend or a volatile stretch. A falling reading means price has settled near its average.
Because the scale settles at 1, the reading is in price units and grows with the price level, so compare it with its own history rather than with another instrument.
Settings
- Source
- The price series measured against its own average. The close by default.
- Period
- The length of the reference EMA and of the error averaging window, which is held to at most 4000 bars.
Frequently asked questions
Why does it read the same as MAE?
The scale is measured only on the first bar, where no earlier bar exists to compare against, so it settles at 1 and the division leaves the error unchanged. The study keeps that calculation exactly as written.
What is the EMA on the price chart?
It is the forecast being scored. The pane shows how far price has been from that line on average.
Why does the line start late?
The EMA has no value until the chart has Period bars, so the error cannot be measured before then.